Projects
GIS, spatial analysis and cartography work spanning accessibility, mobility, public transport and geoprocessing.
Web Development Projects
Small JavaScript and HTML/CSS projects deployed from GitHub using Netlify.
Leads Tracker App
A JavaScript app for saving and organising useful URLs, published as a live Netlify deployment from GitHub.
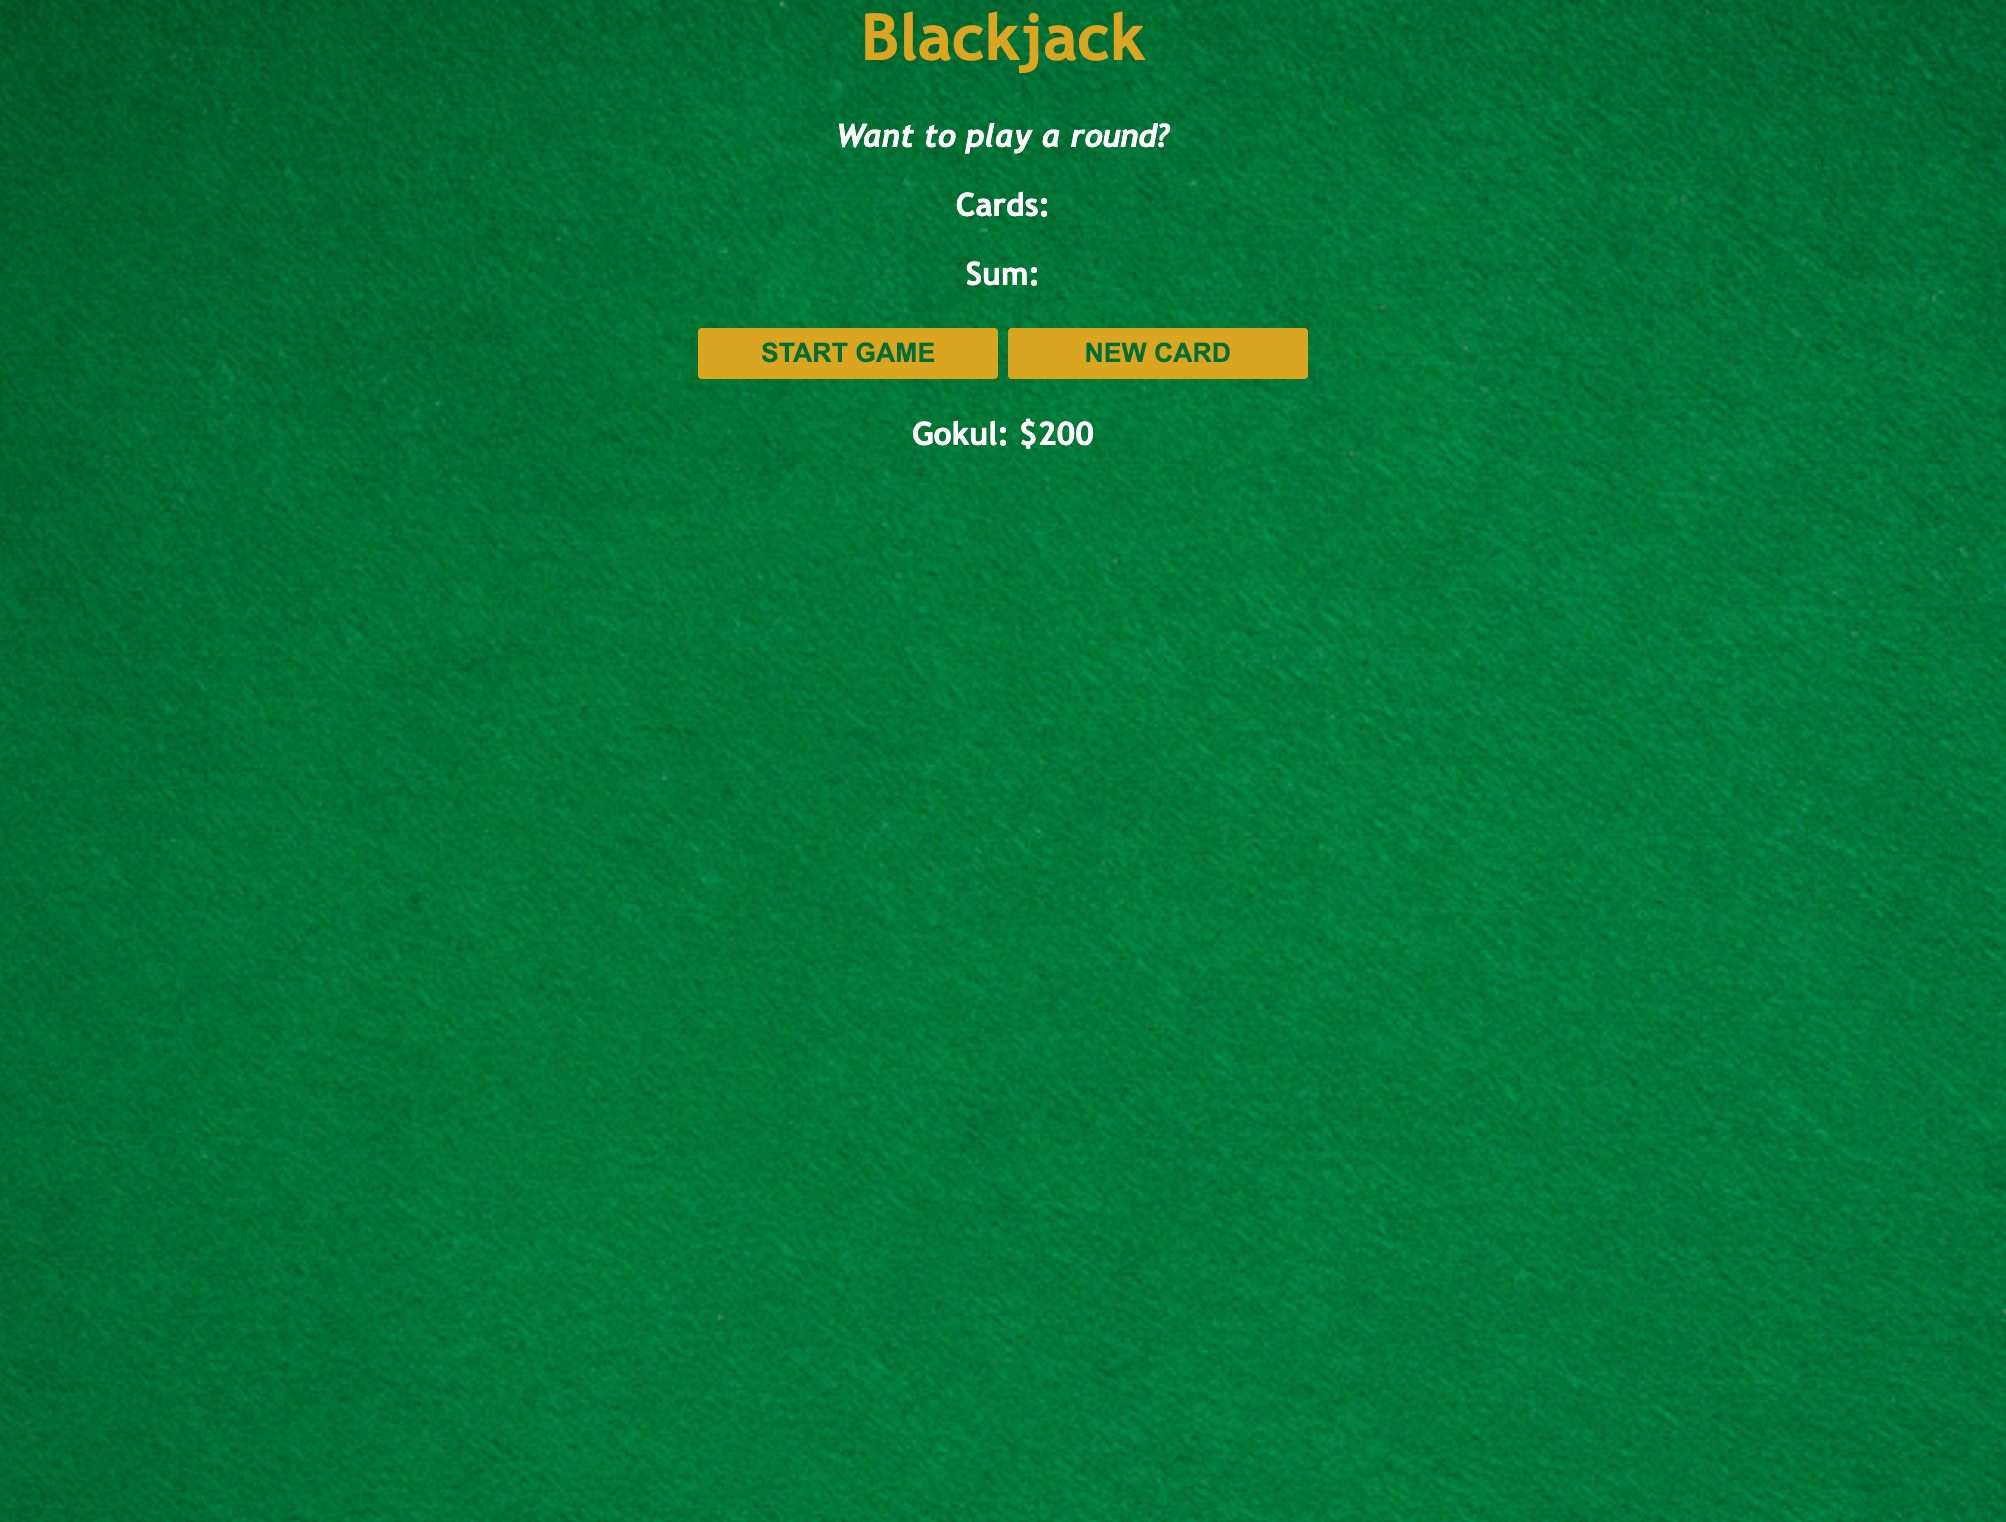
Blackjack Game
A browser-based Blackjack game focused on JavaScript logic, scoring, UI state, and Netlify deployment.
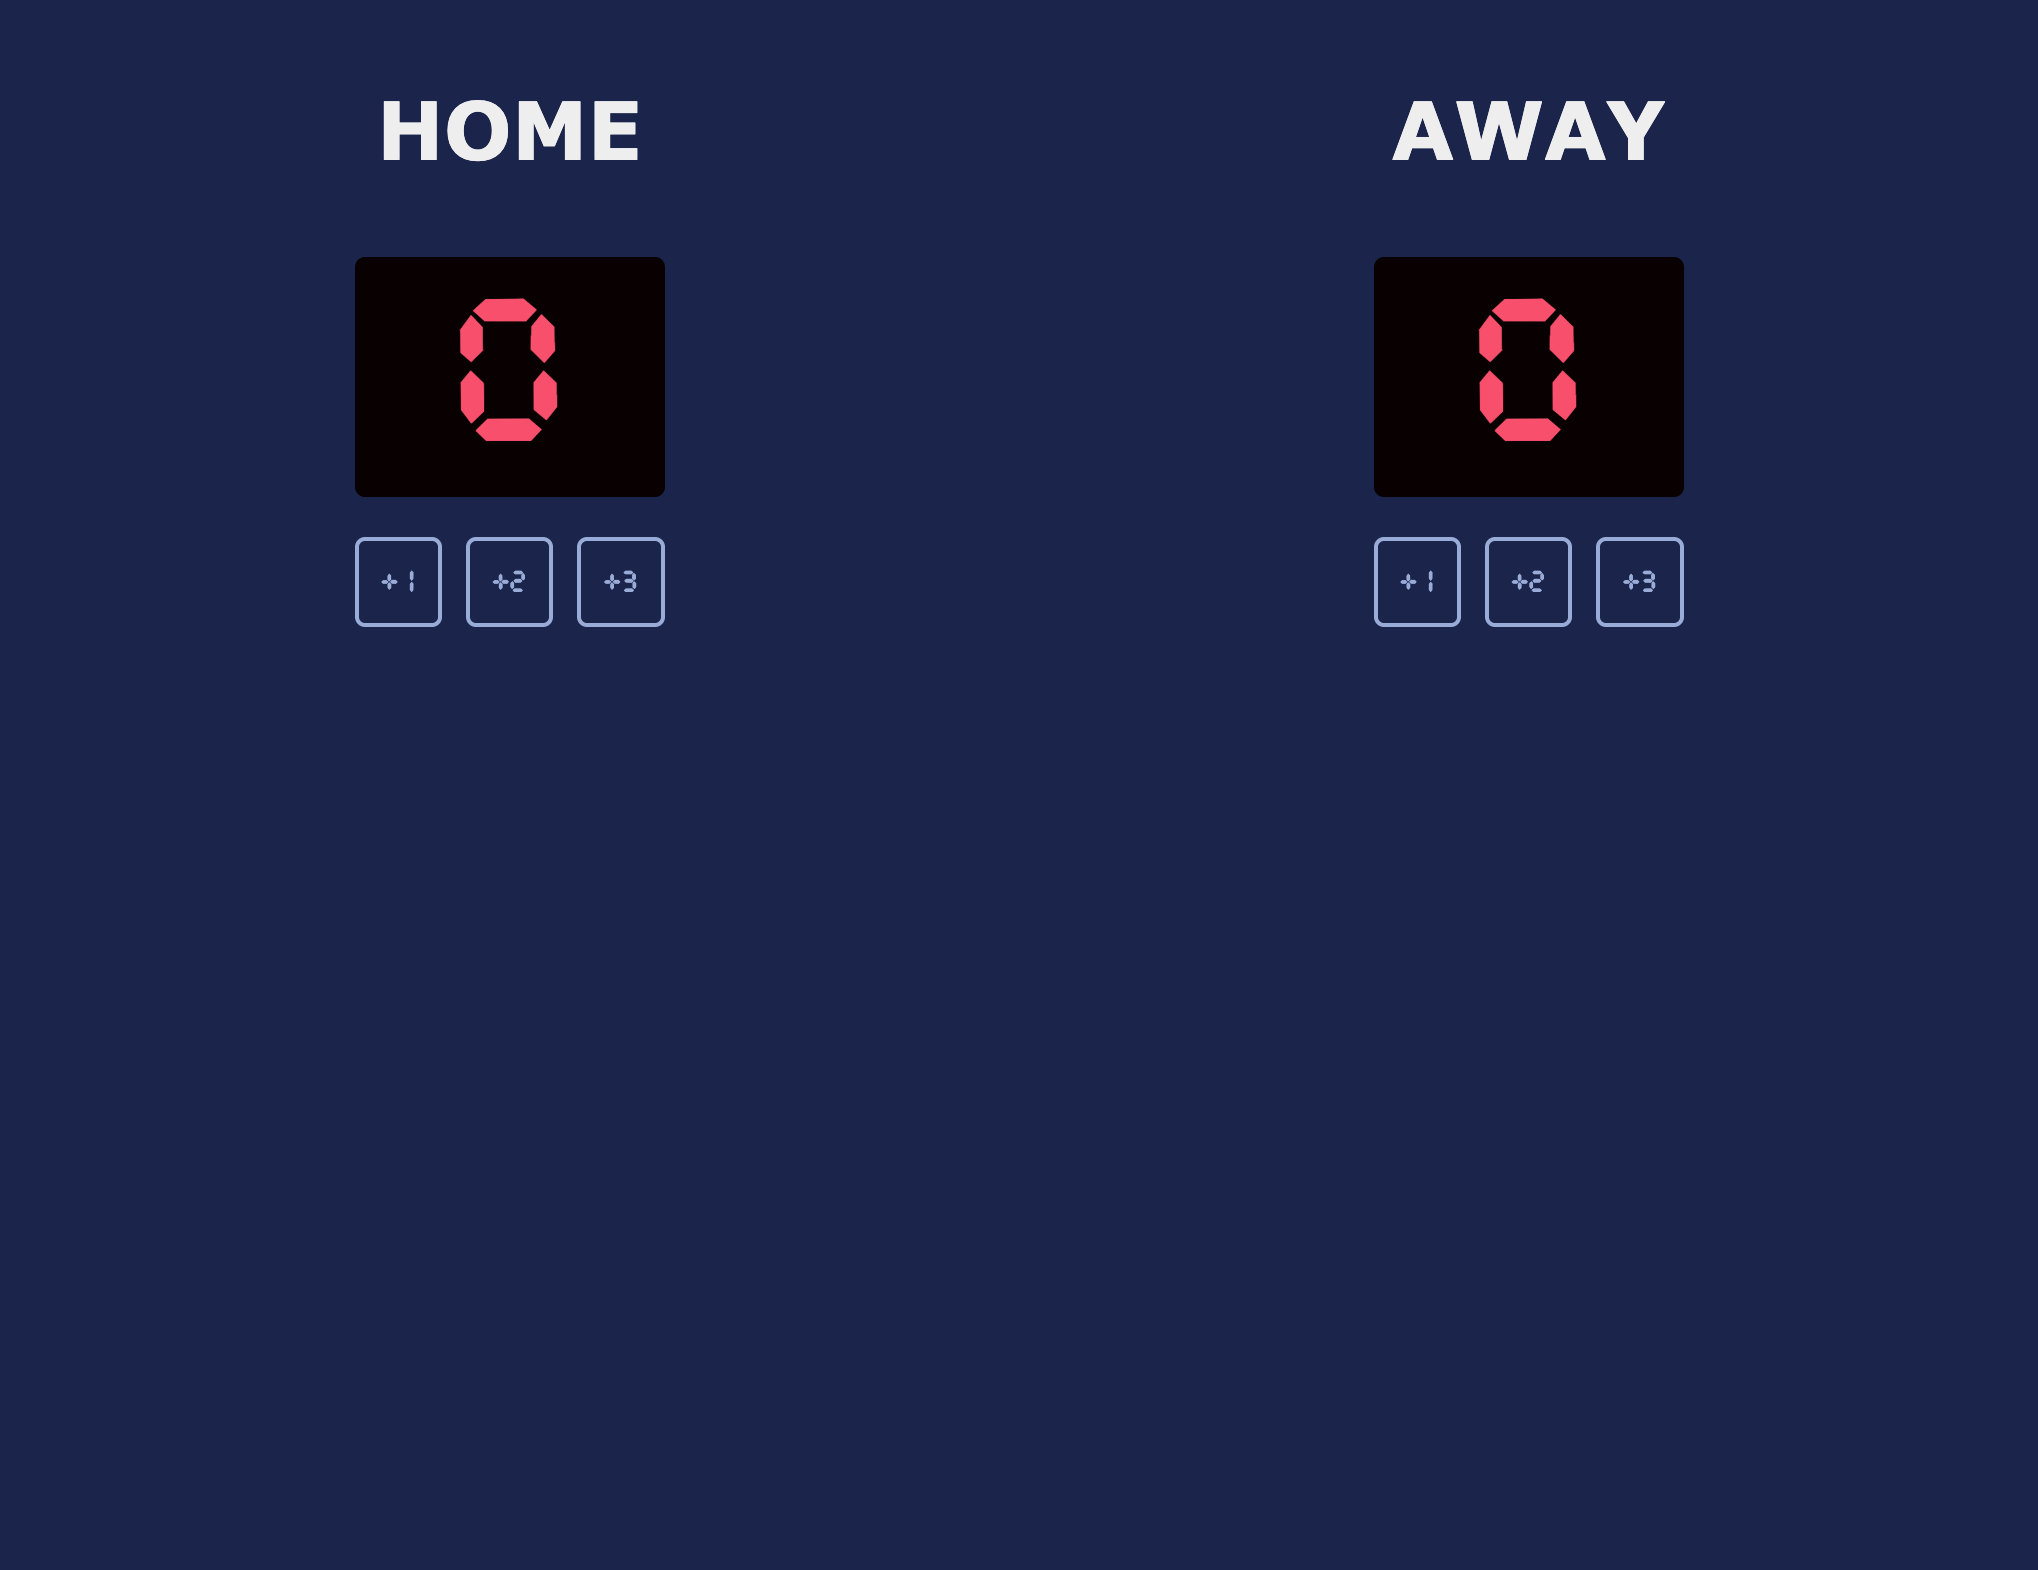
Scoreboard
A simple scoreboard app with live score controls, hosted as a Netlify site connected to GitHub.
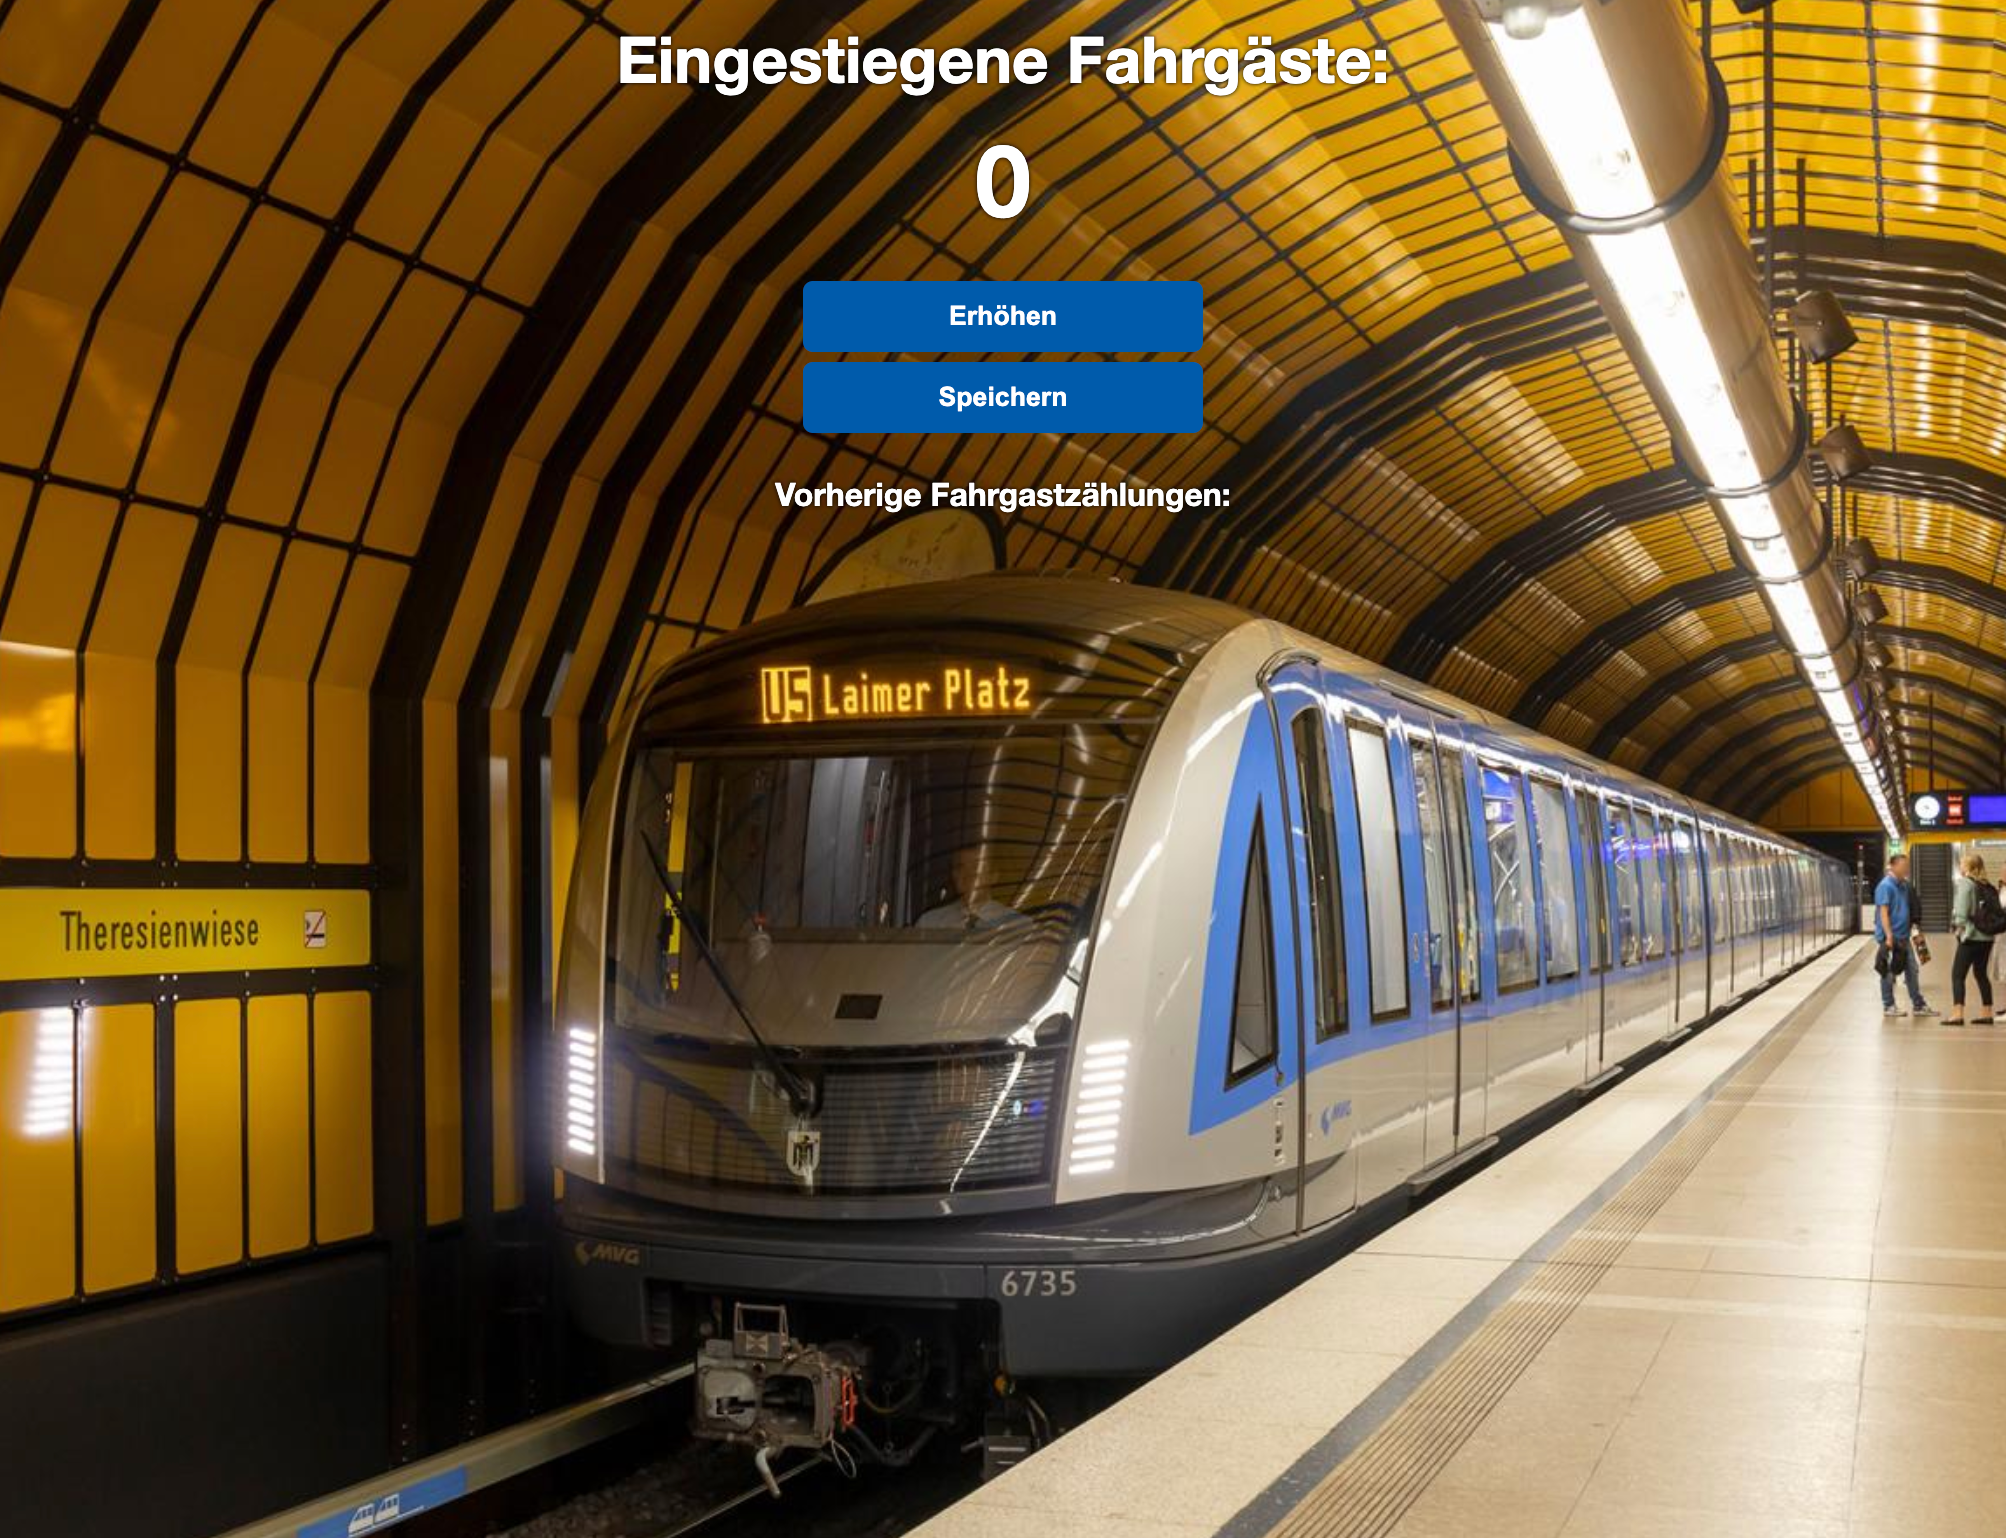
Passenger Counter
A passenger counter app for Munich U-Bahn use cases, built with JavaScript and deployed on Netlify.
Digital Business Card
A compact personal business card page for practicing responsive HTML/CSS and publishing through Netlify.
Plan4Better Projects
Accessibility, mobility and GOAT-based planning work connected to Plan4Better experience and workflows.
Rhein-Neckar EV Charging Accessibility
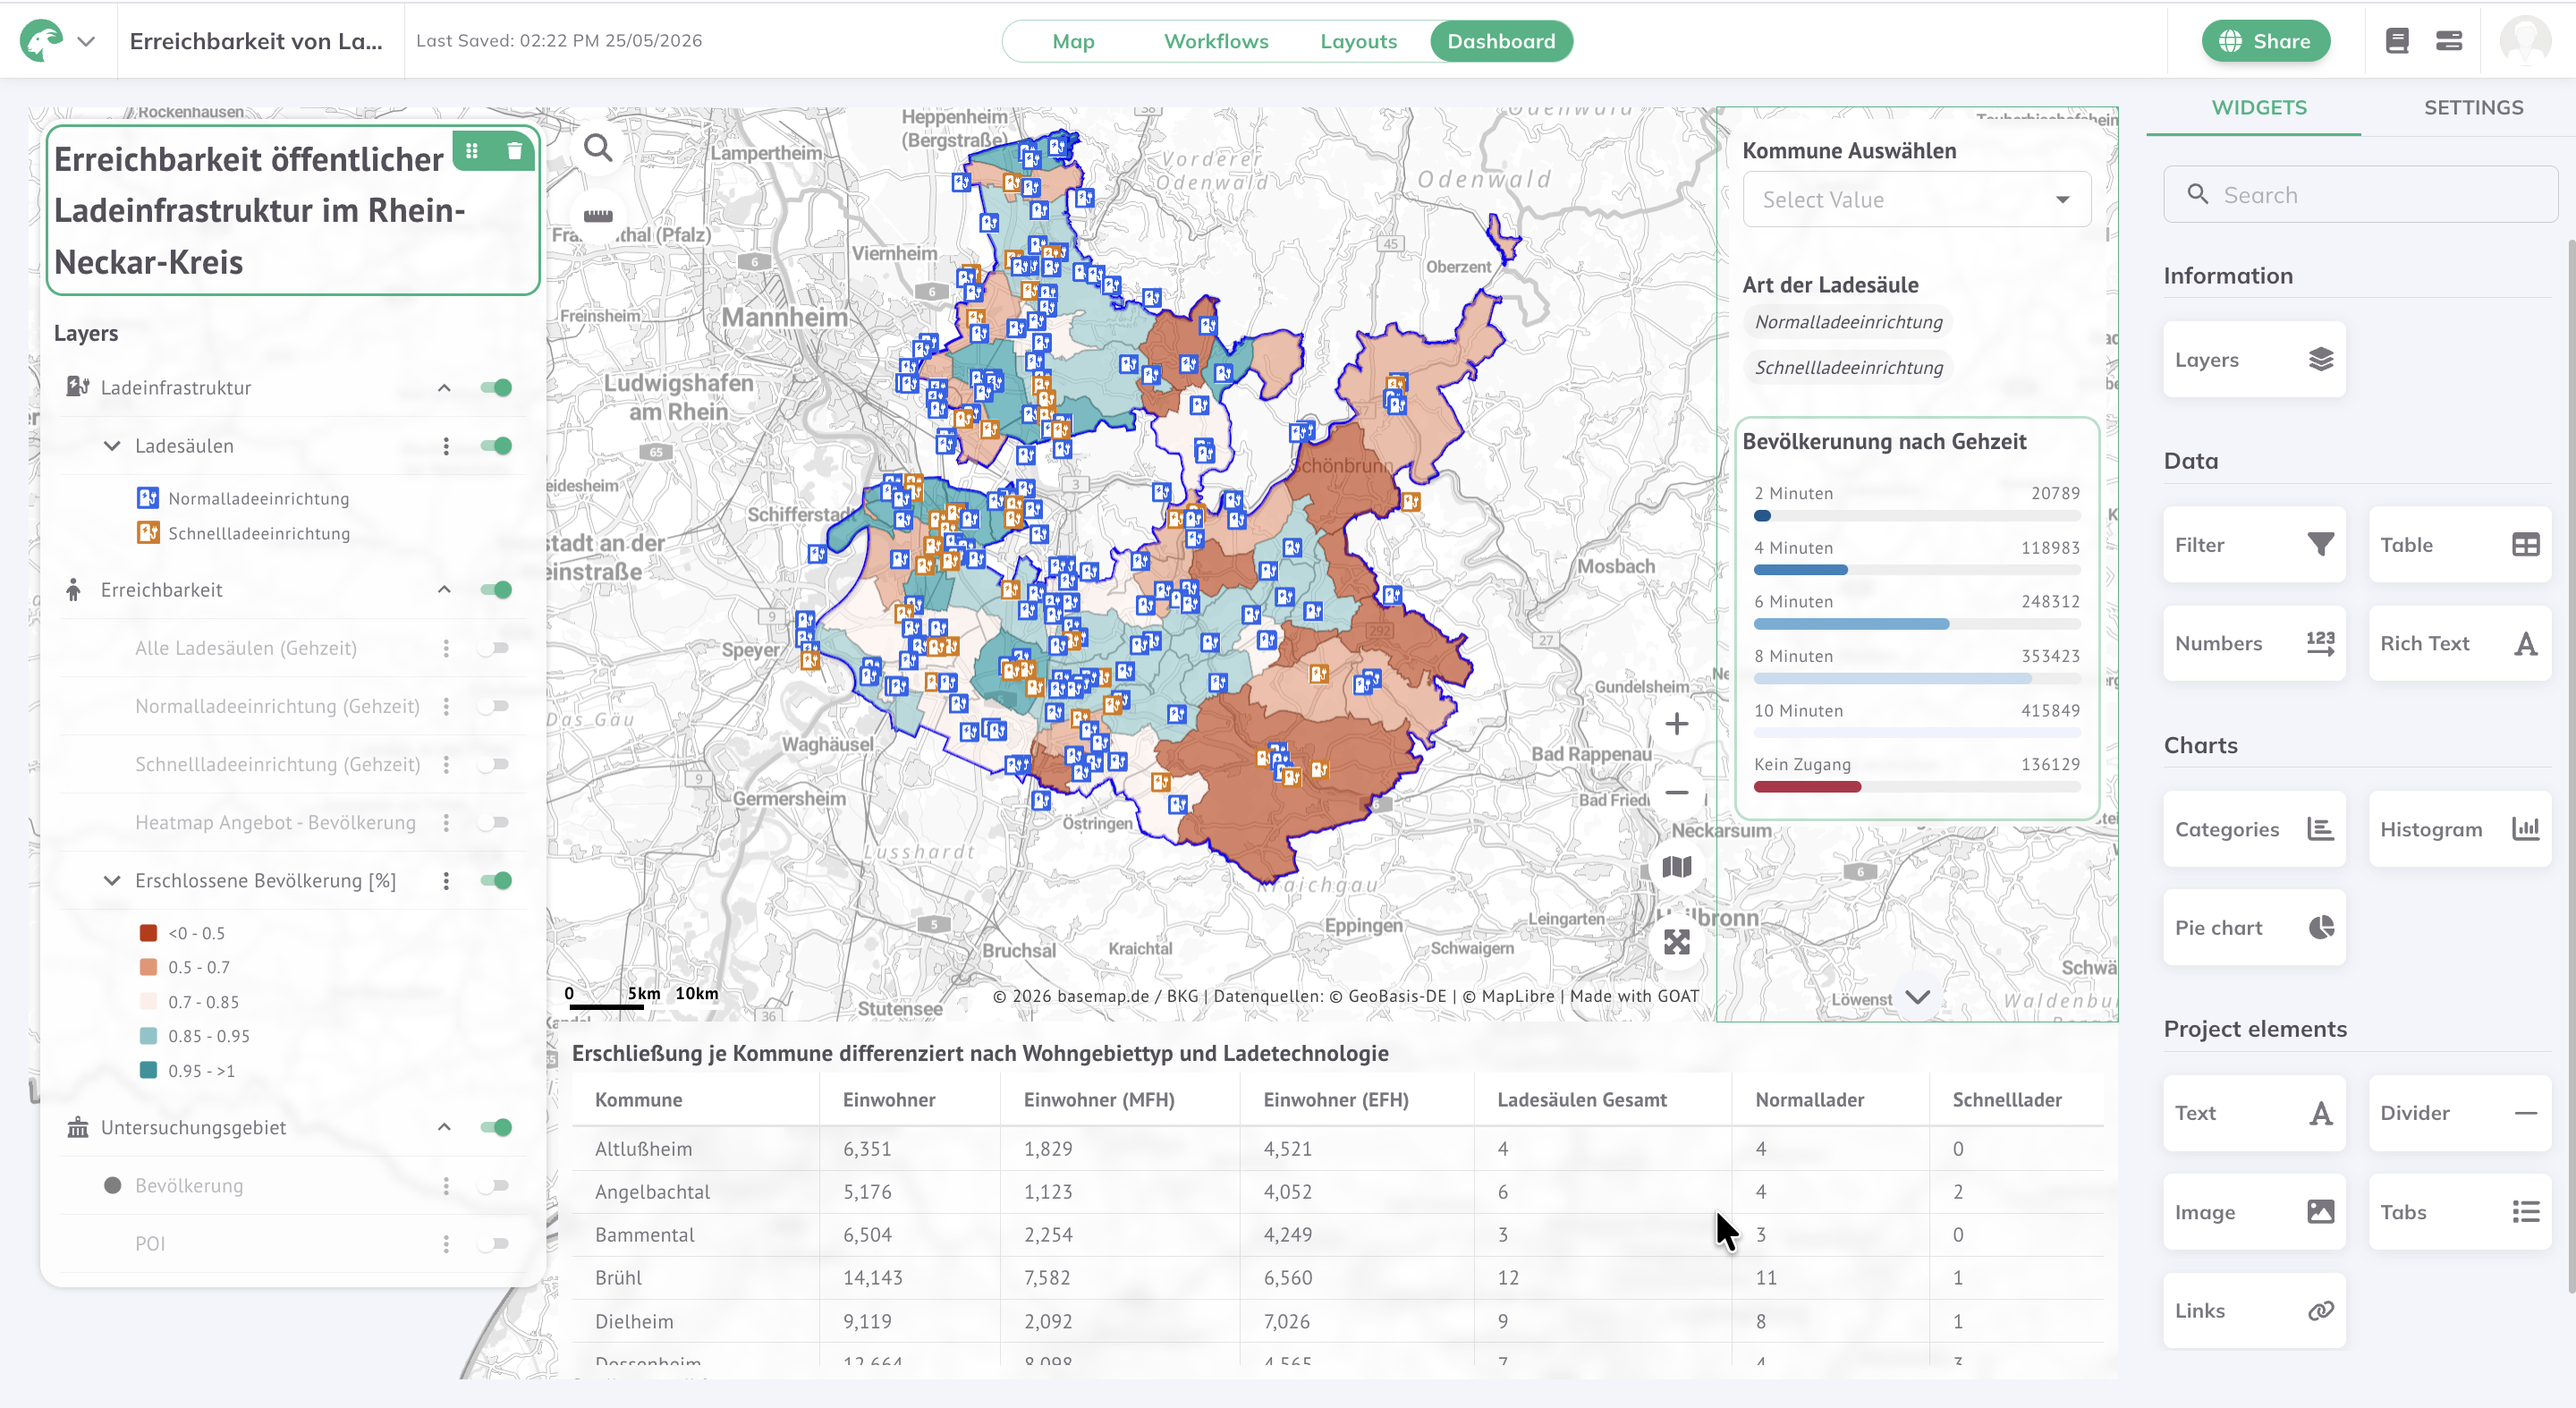
Interactive GOAT dashboard analysing walking-time access to public charging stations across Rhein-Neckar-Kreis, segmented by charger type and housing type (MFH/EFH).
Münster Nahversorgung Accessibility
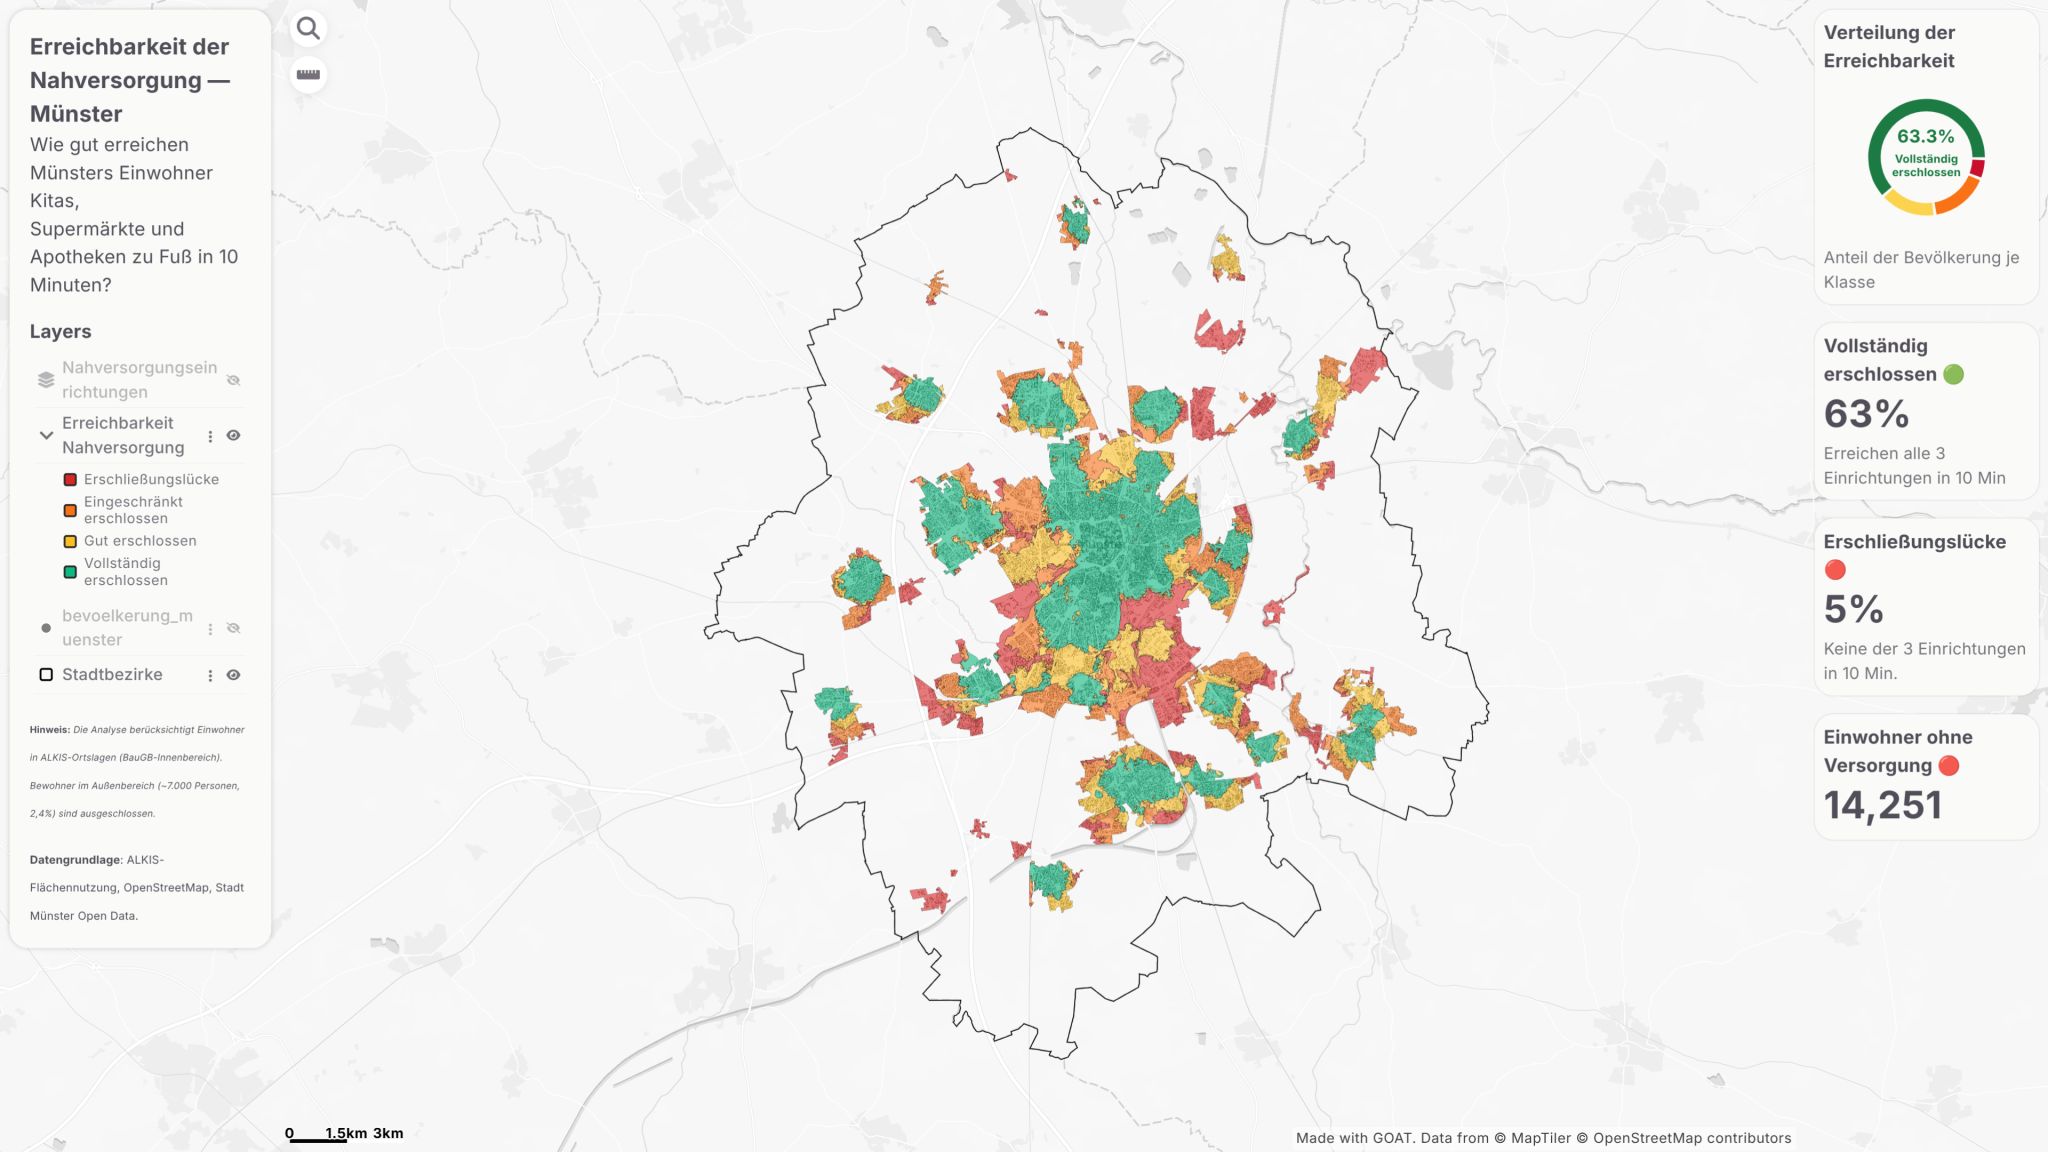
GOAT dashboard scoring walking access to Kita, supermarket and pharmacy across Münster using the BBSR Nahversorgungs-Erreichbarkeit standard — no local processing step in the pipeline.
Rheinbach Kommunale Wärmeplanung
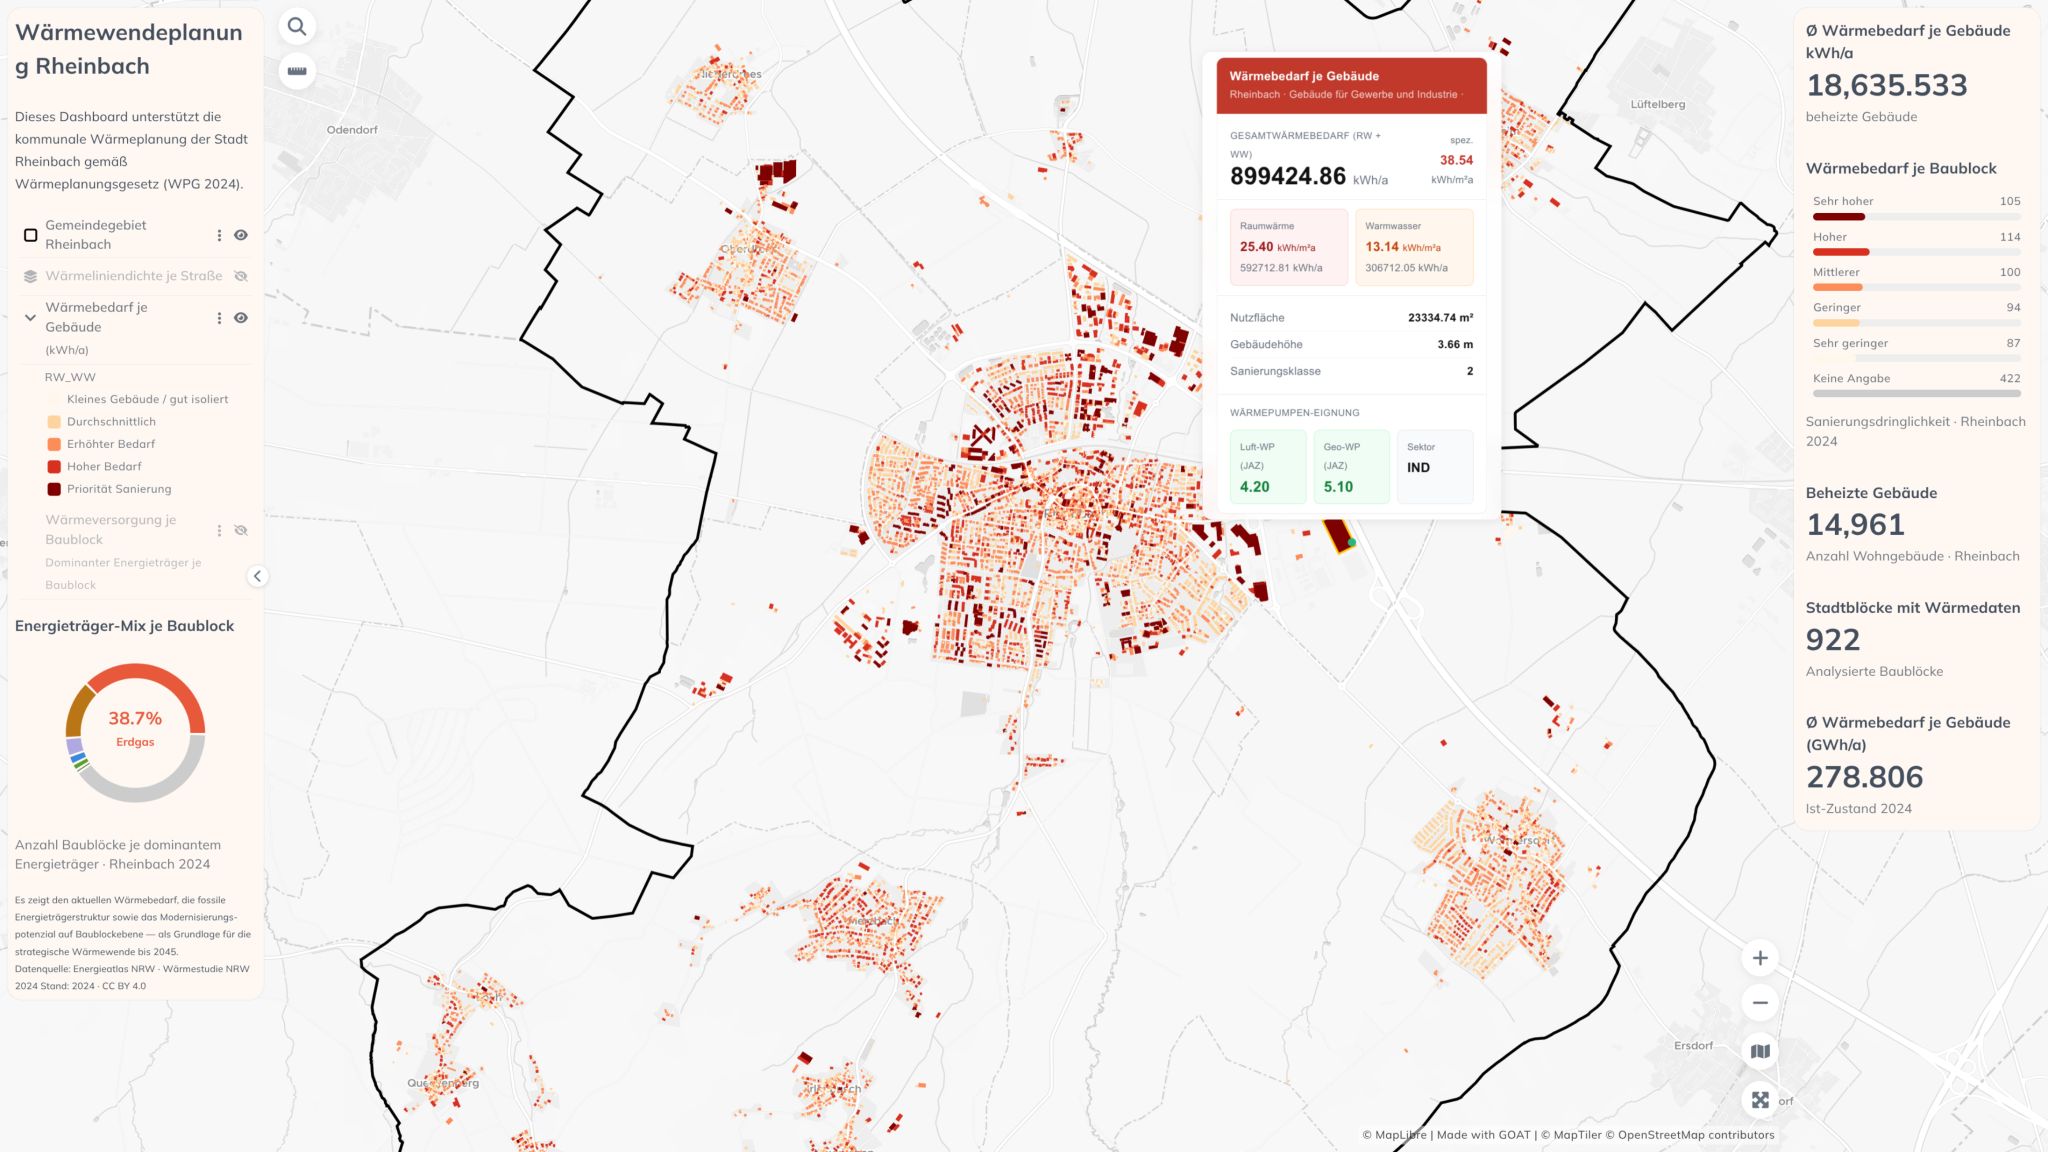
GOAT dashboard for municipal heat planning in Rheinbach, NRW — building-level heat demand, gas dependency and heat pump suitability using LANUV Wärmestudie NRW open data.
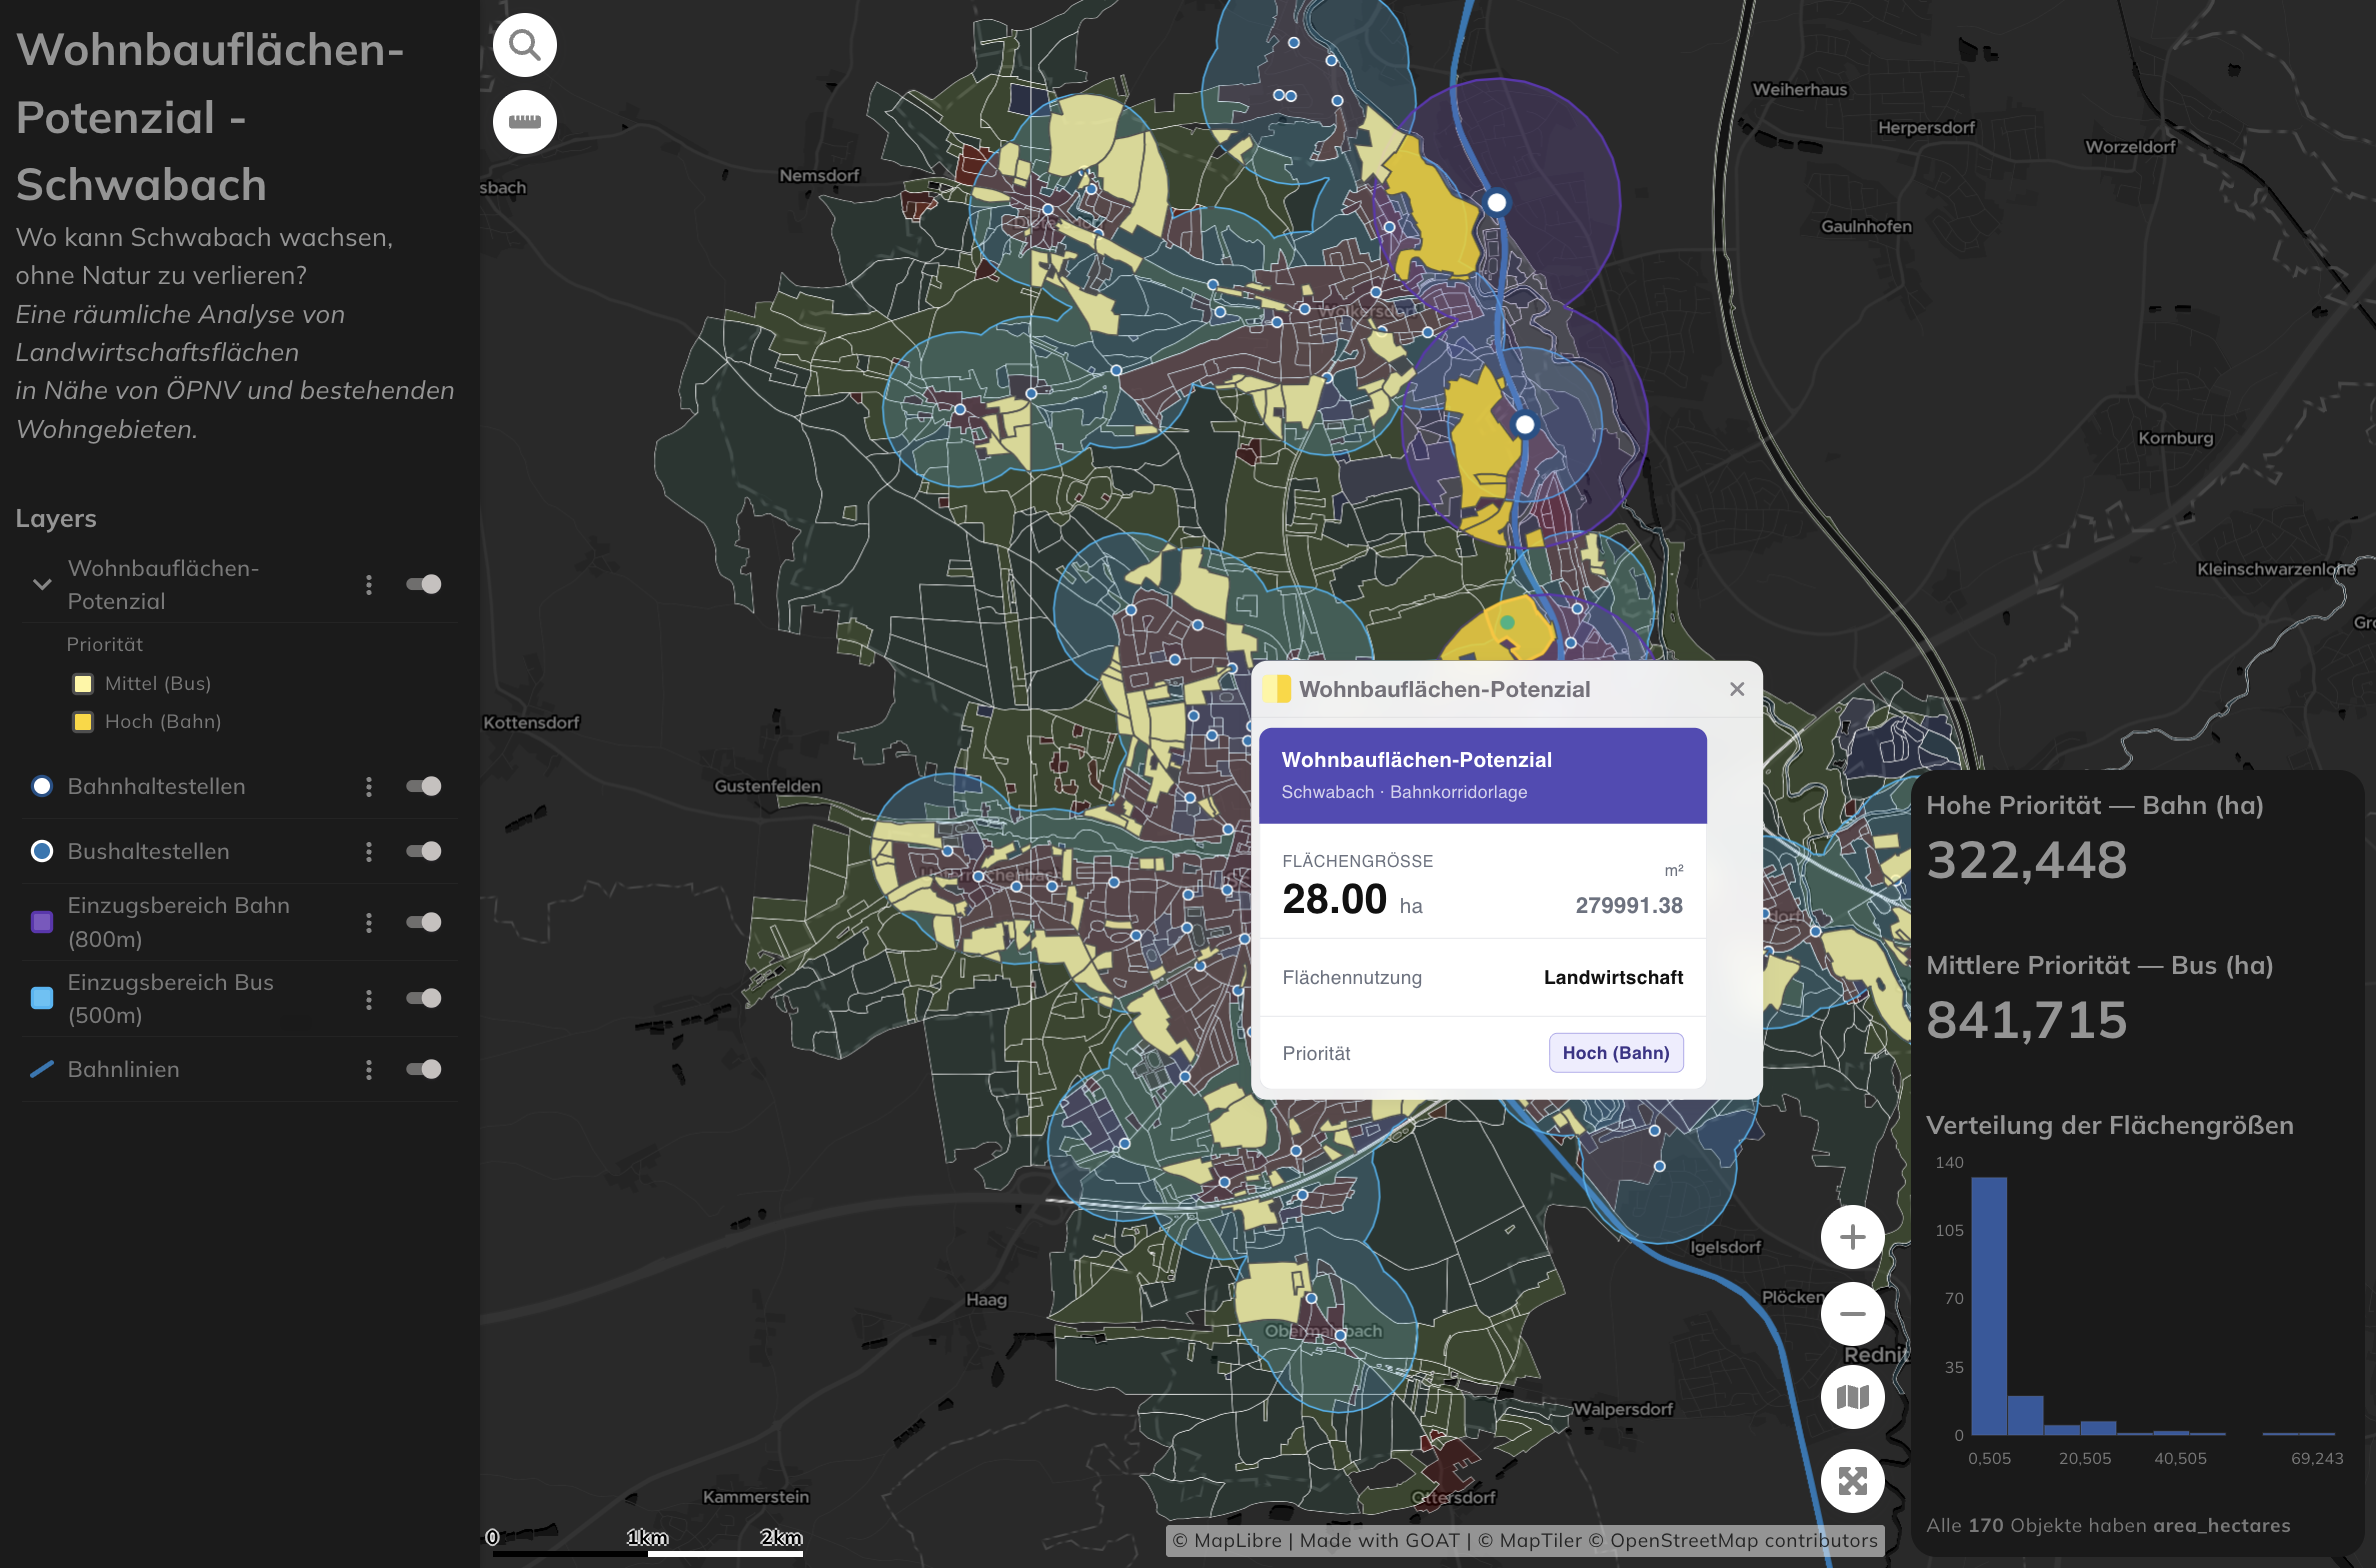
322 Ha of Buildable Farmland Around Schwabach
Multicriteria spatial analysis identifying transit-accessible, housing-adjacent farmland parcels in Schwabach, Bavaria — using ALKIS, GTFS and OSM open data in GOAT.
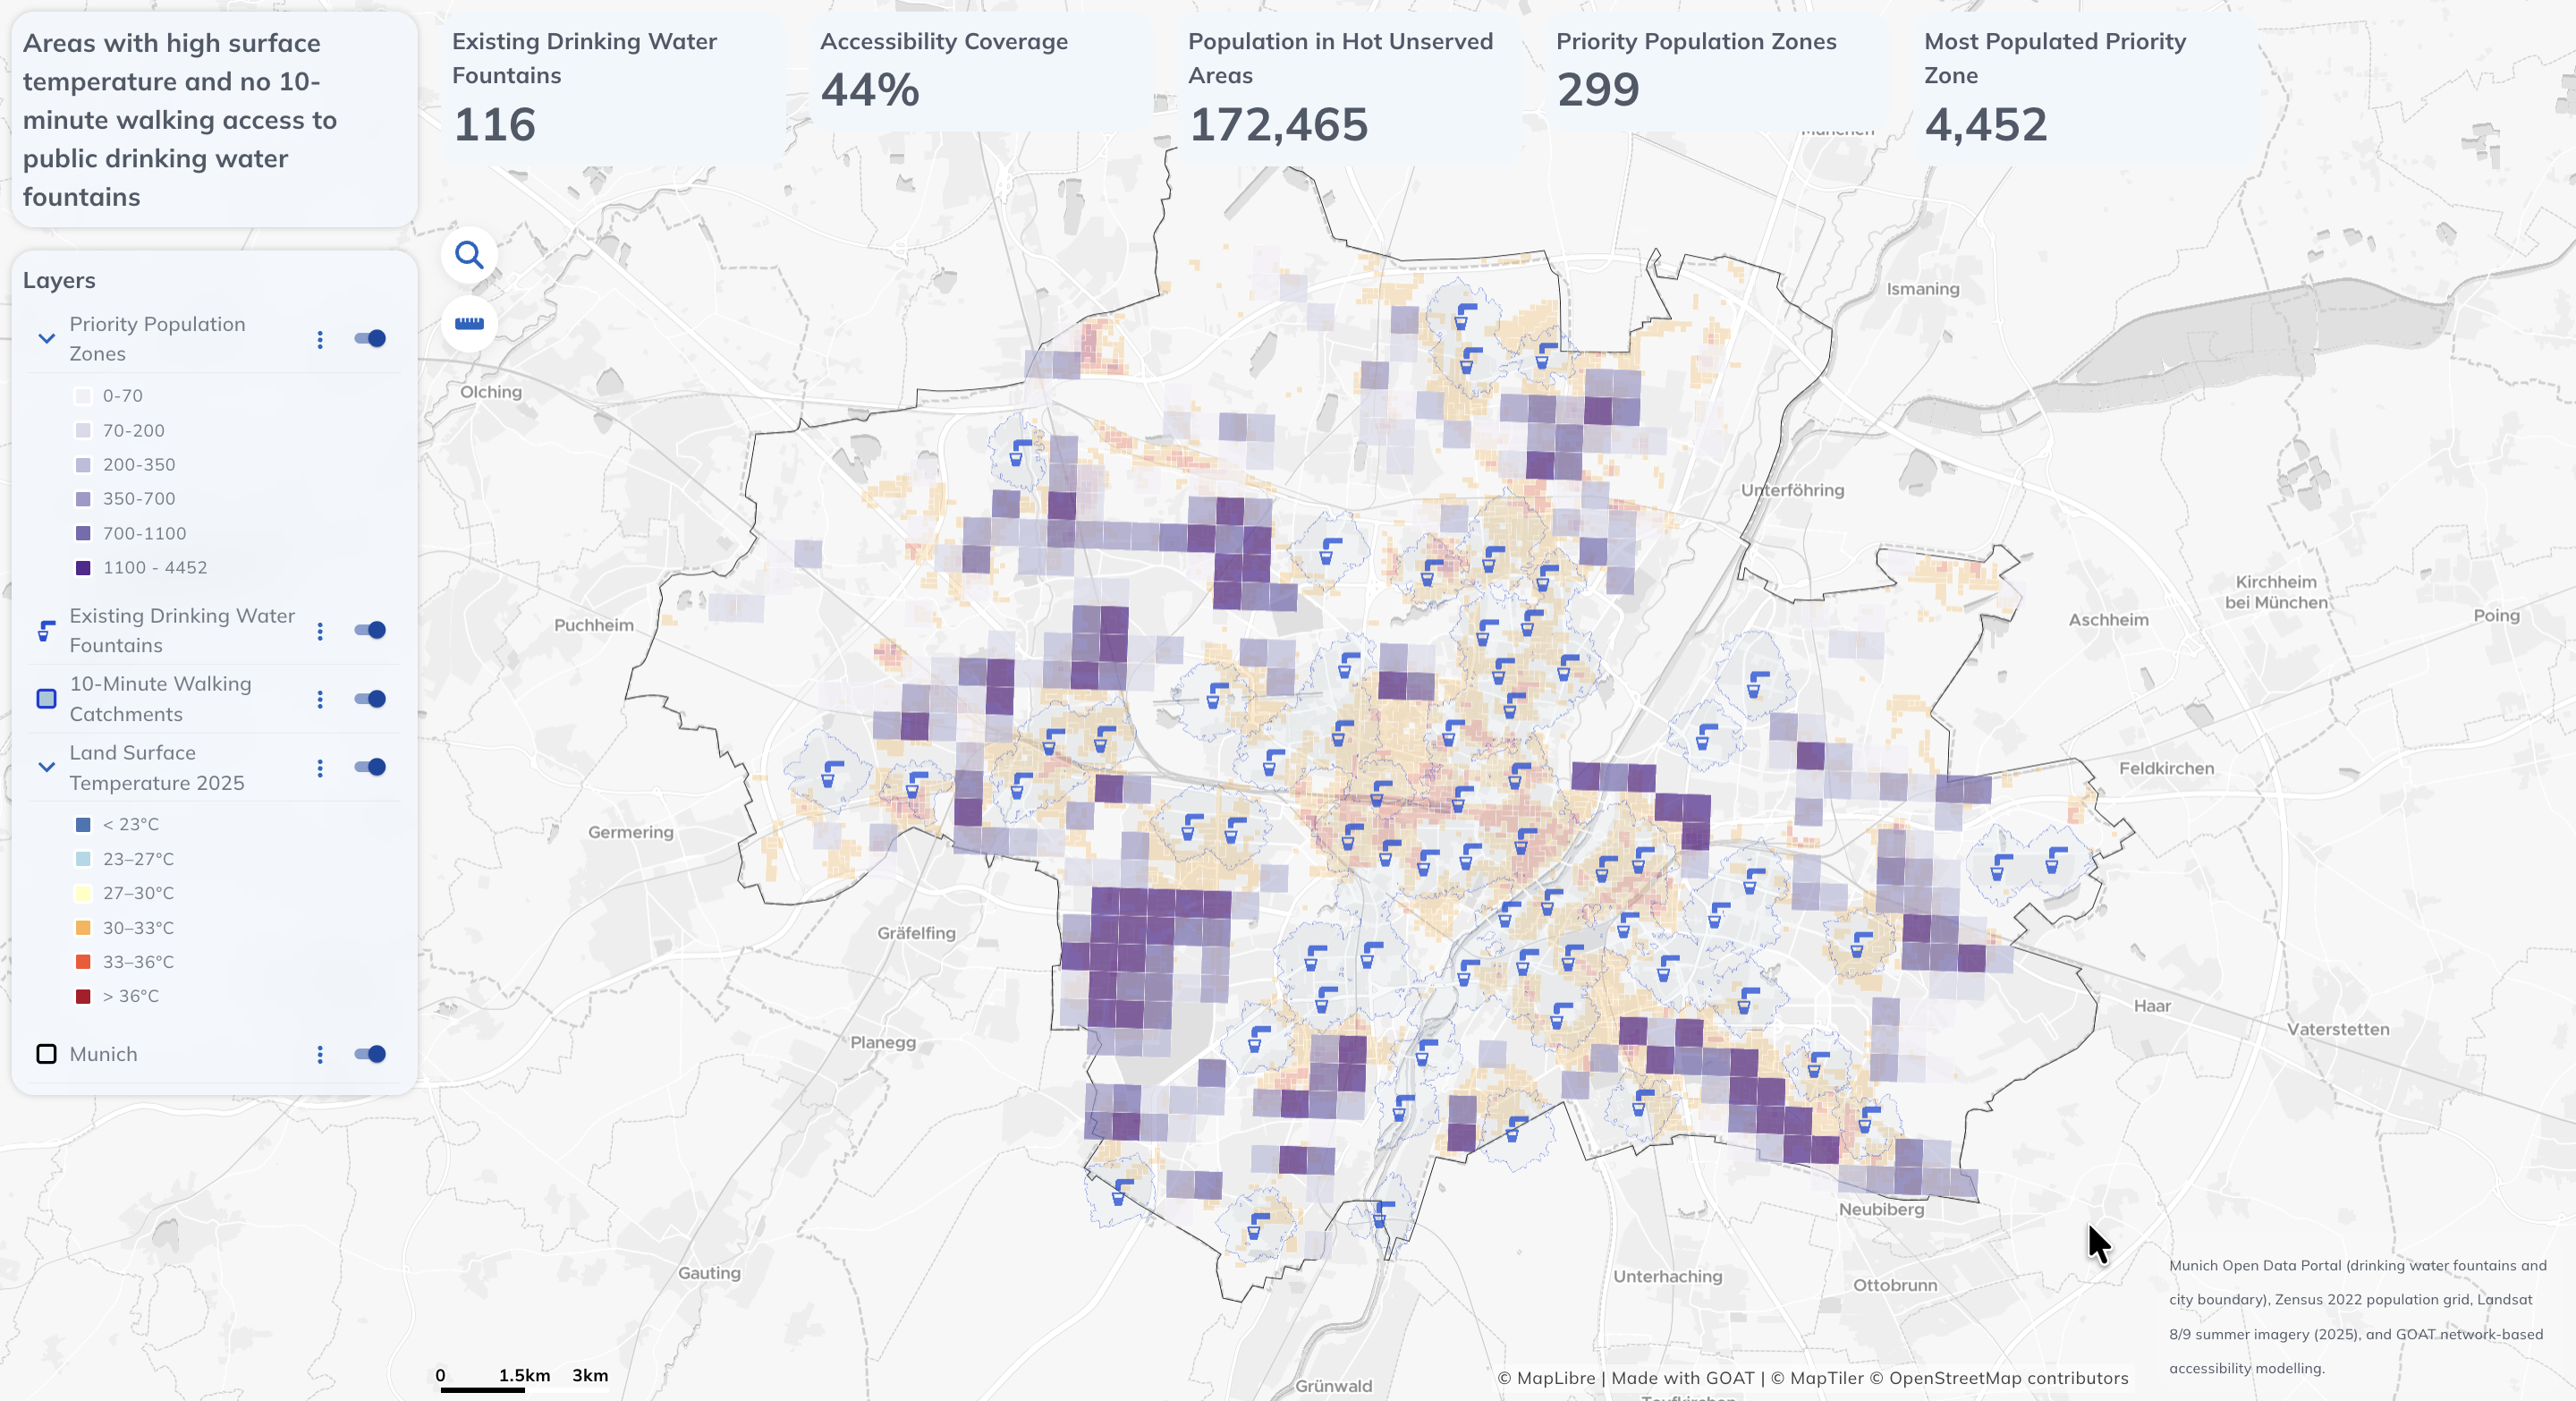
Munich Drinking Fountain Accessibility
Network-based walking catchments, land surface temperature and population data combined in GOAT to identify 299 priority zones for new public drinking water infrastructure in Munich.
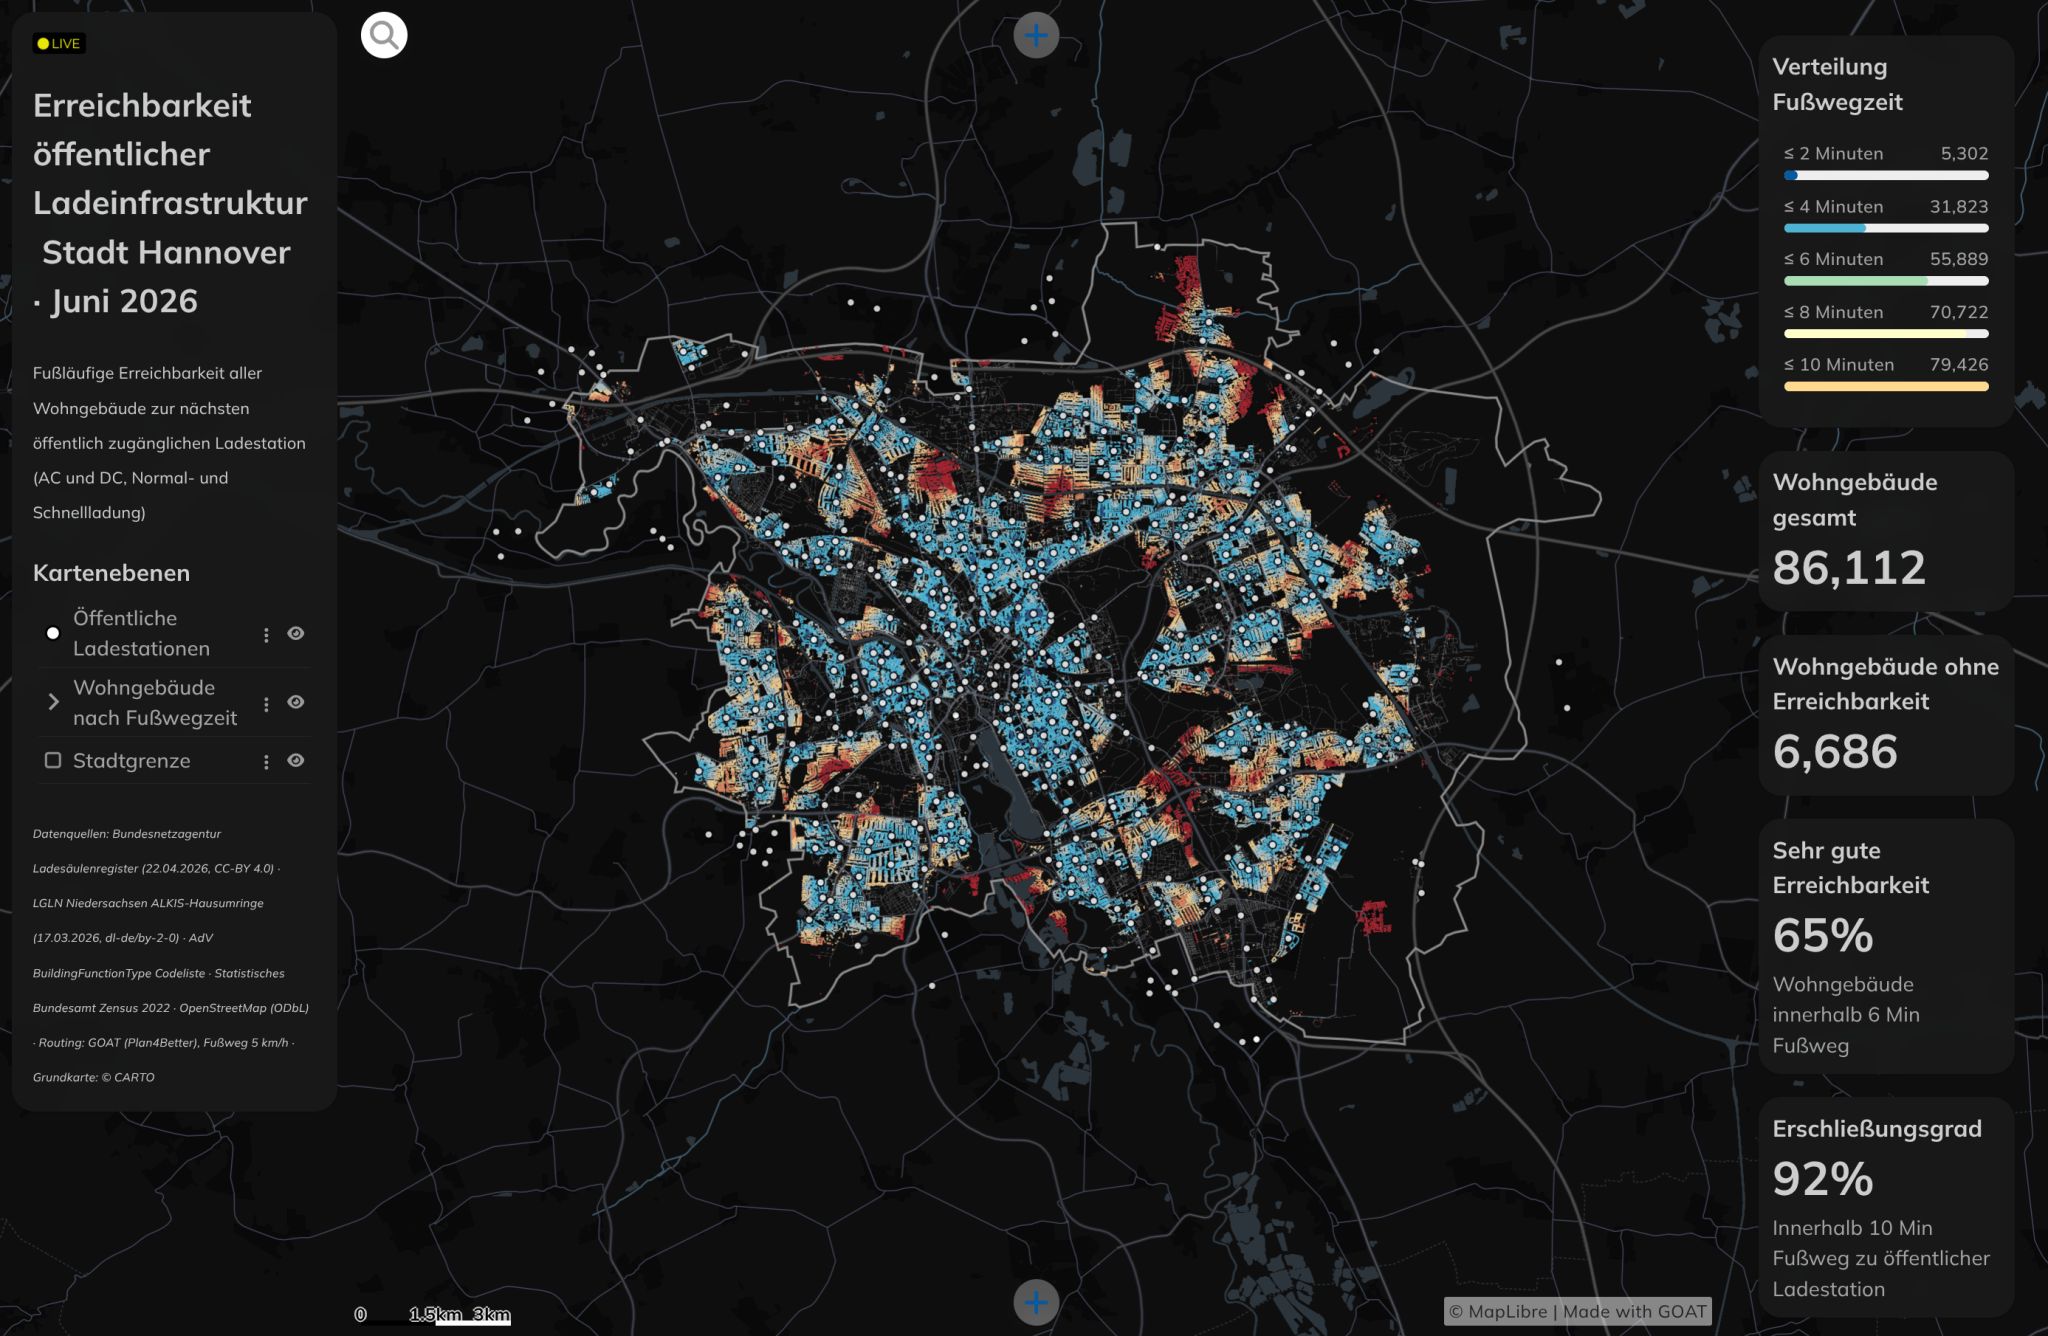
Hannover EV Charging Accessibility
Building-level walking-distance access to 1,049 public EV chargers across Hannover — 92% of residential buildings within 10 minutes, 6,686 outside walking range entirely.
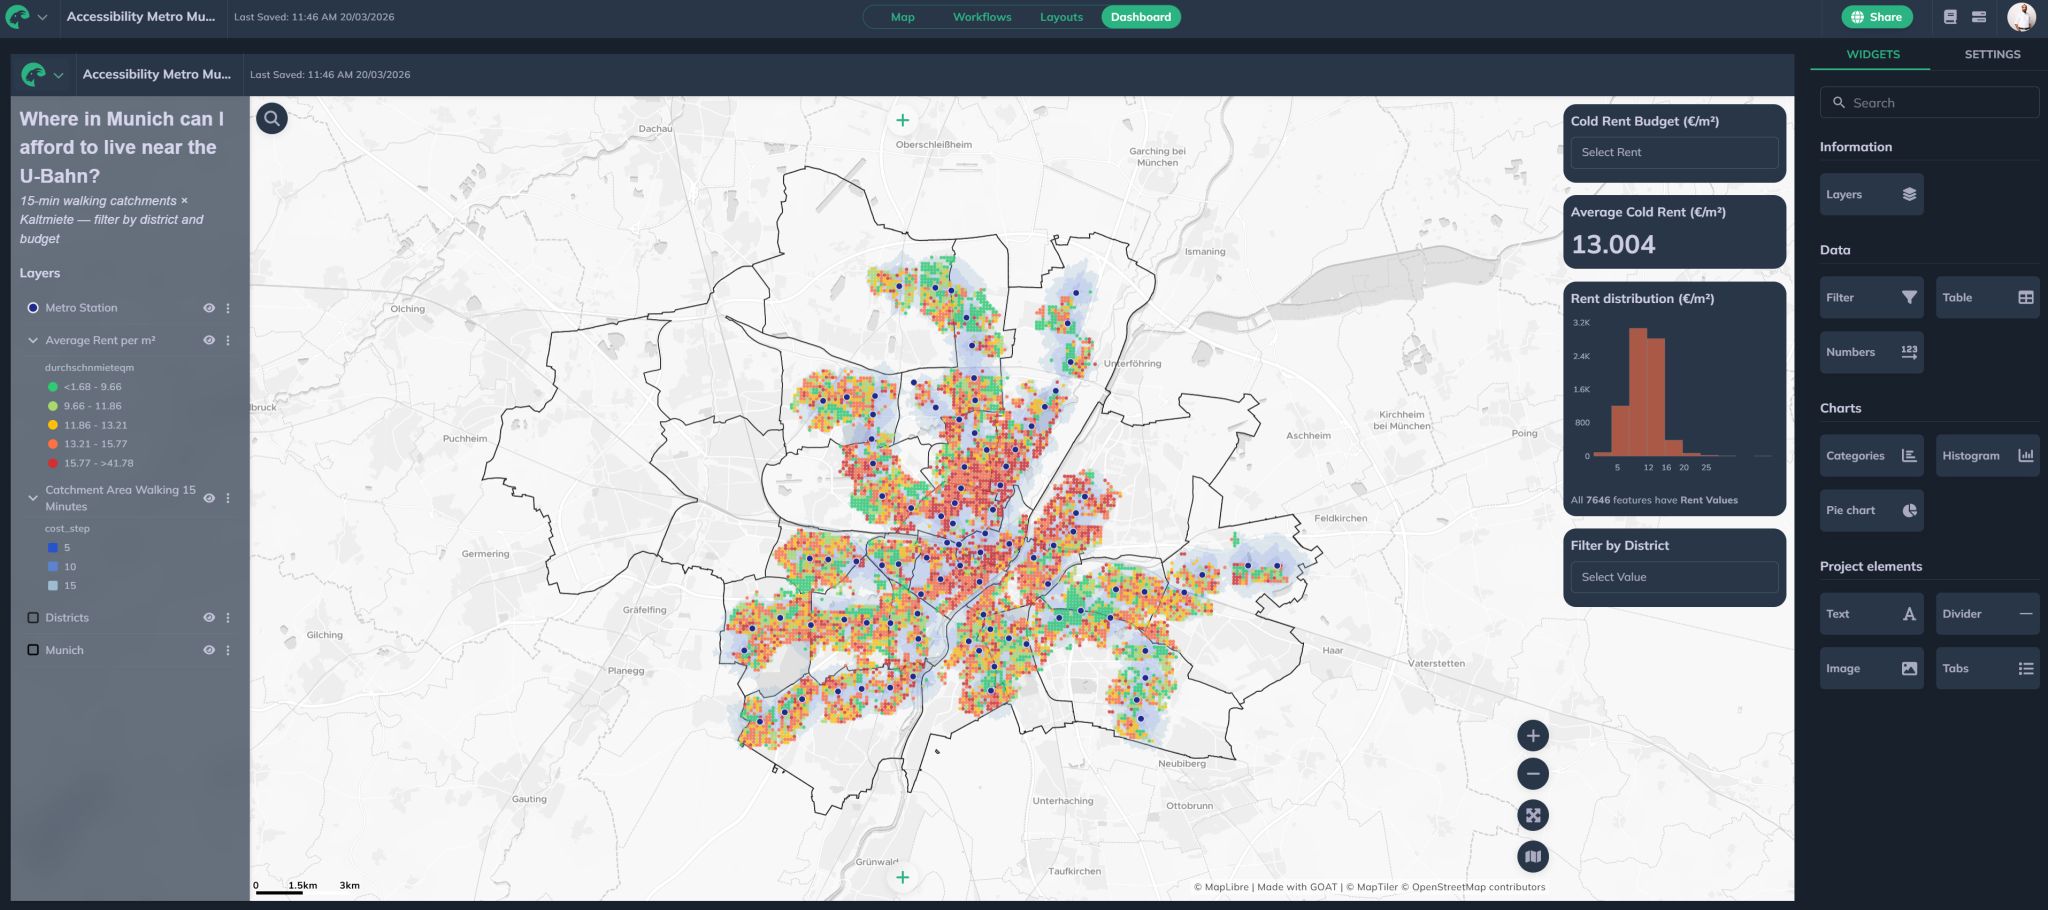
Munich Housing Accessibility
Dashboard combining rental cost data with public transport accessibility indicators for Munich neighbourhoods.
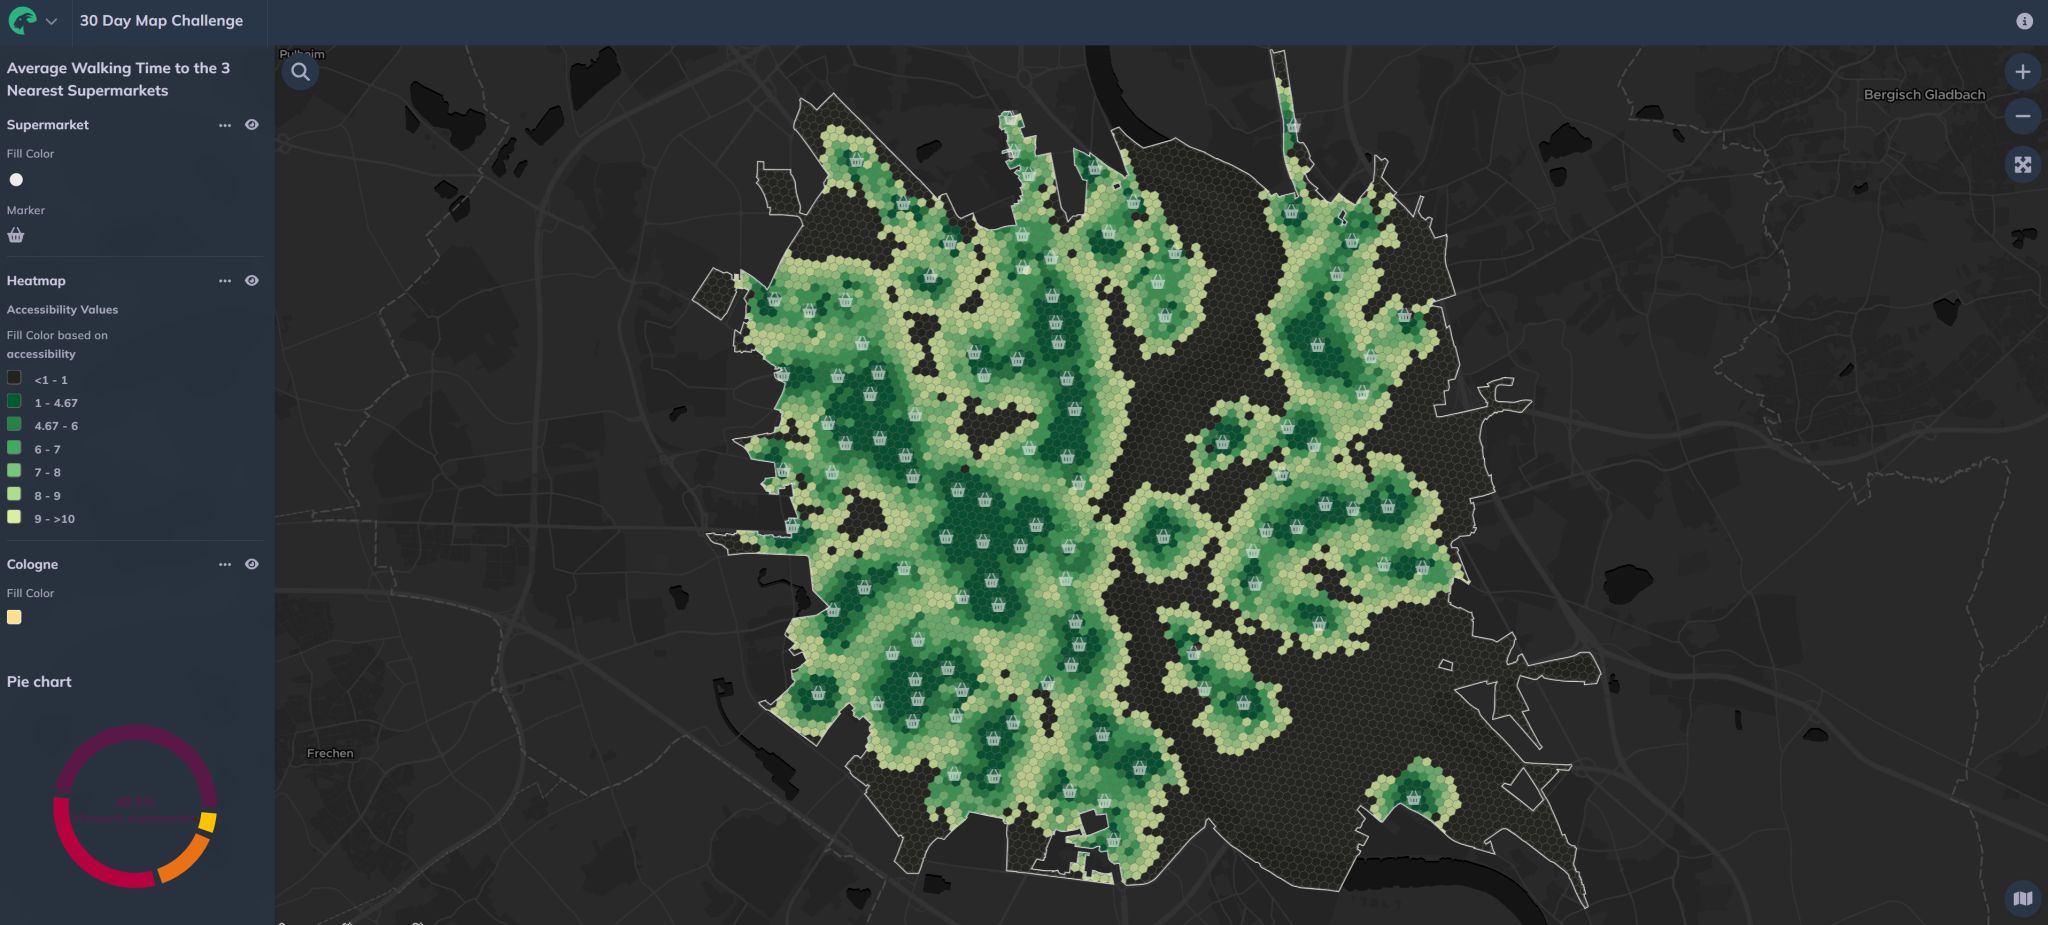
Cologne Supermarket Accessibility
H3 hexagon grid map of walking accessibility to supermarkets across Cologne, using the Closest Average indicator in GOAT.
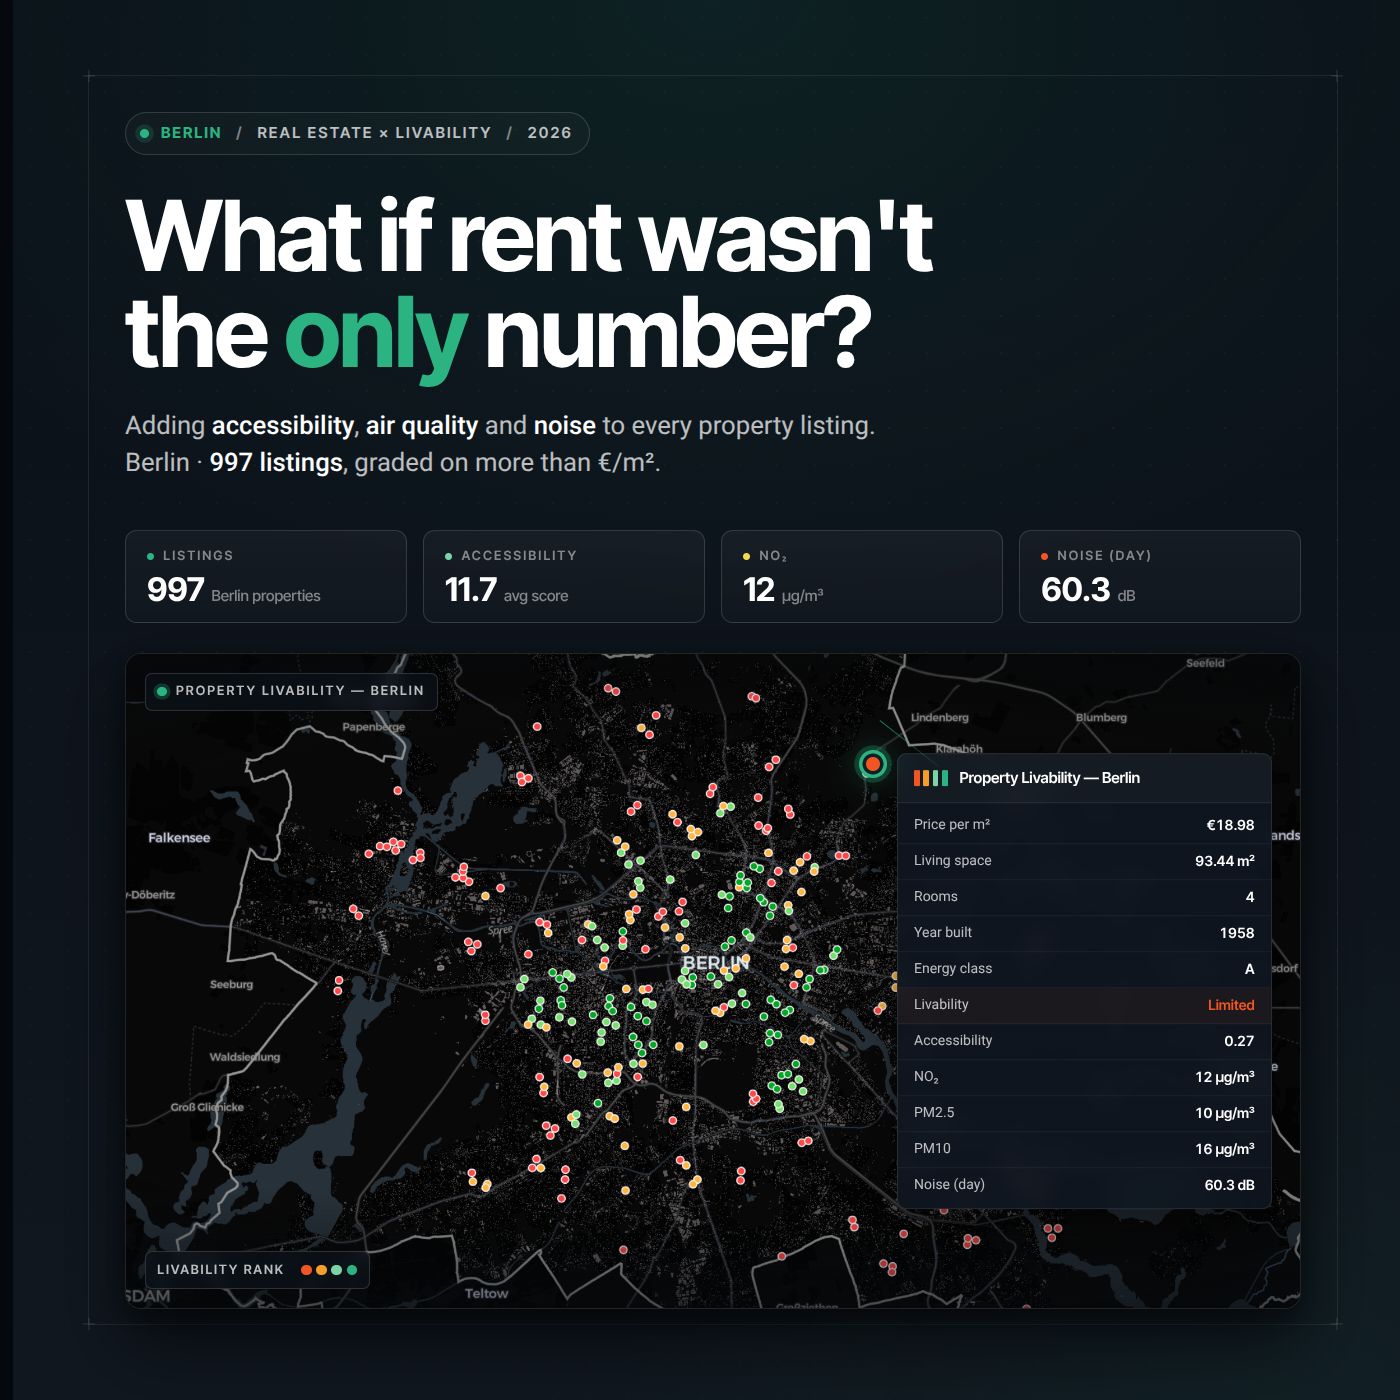
Berlin Rental Listings — Accessibility & Environmental Scoring
Enriching ~1,000 synthetic Berlin listings with a gravity-model accessibility score and environmental data (NO₂, PM10, noise) using GOAT.
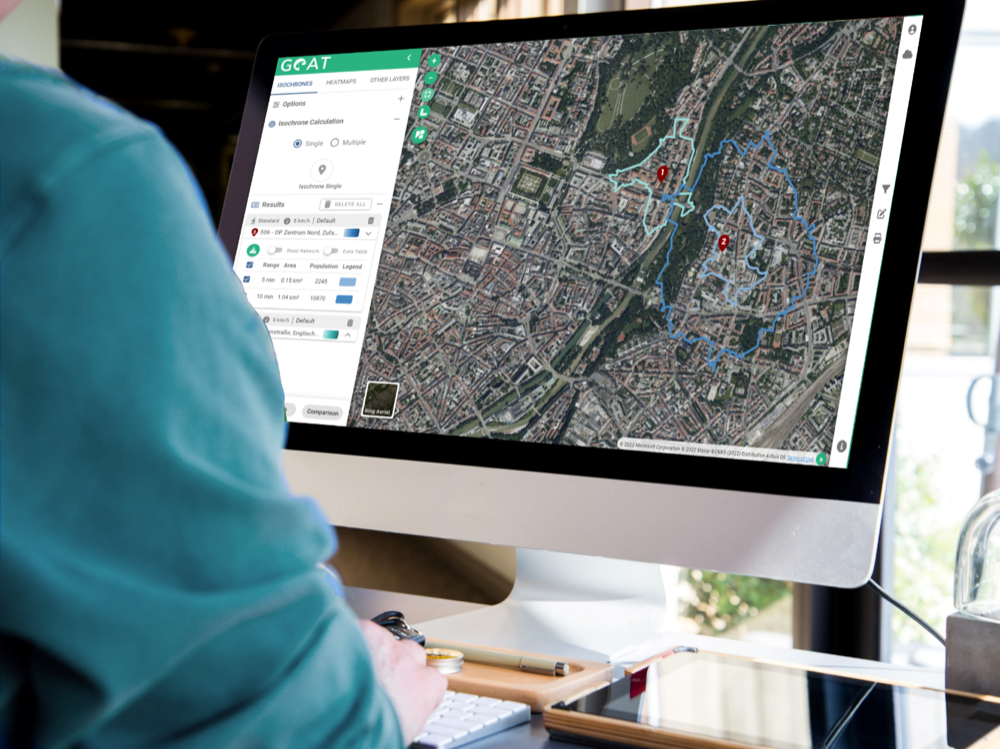
Plan4Better Internship
GIS internship at Plan4Better — accessibility, walkability, public transport analysis across German cities using GOAT.
Spatial Analysis Projects
GIS, cartography, public transport, mobility and geoprocessing projects outside the Plan4Better section.
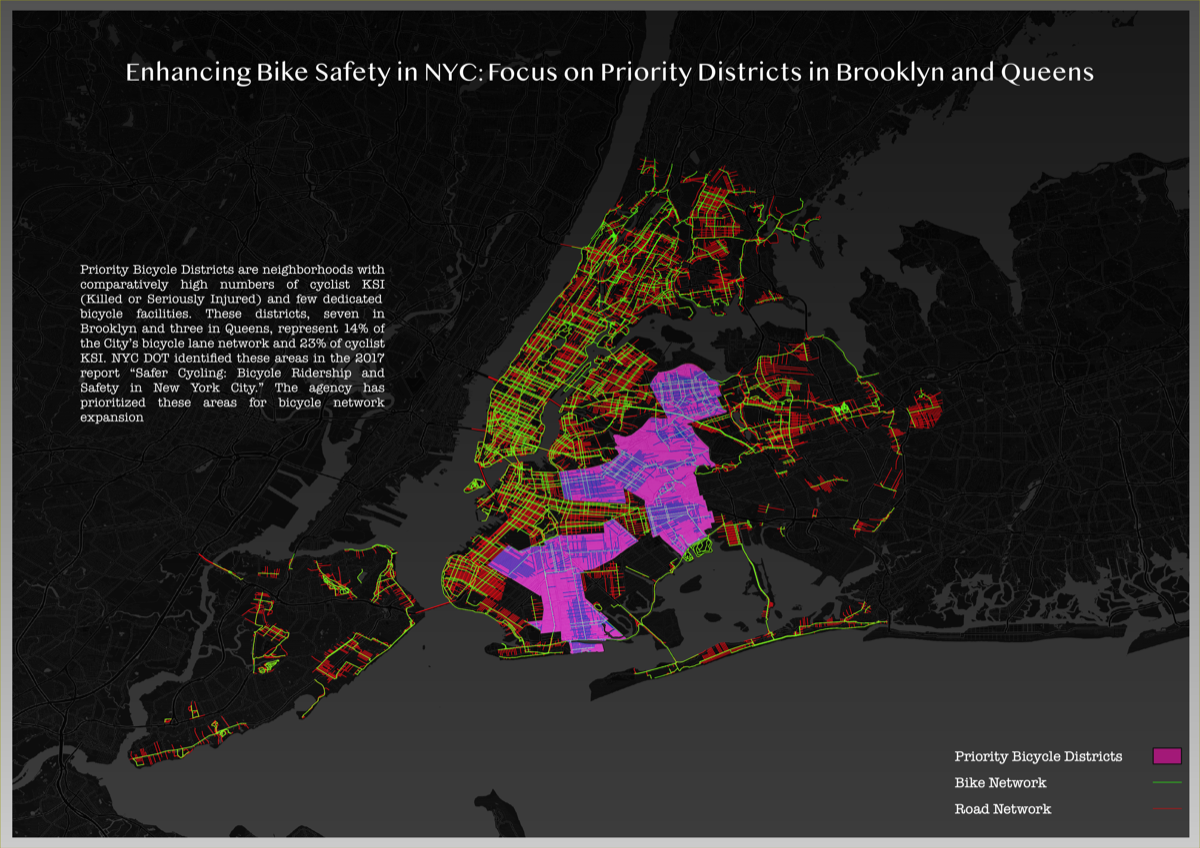
Enhancing Bike Safety in NYC
Priority bicycle district analysis for Brooklyn and Queens, combining bike network and road network context.
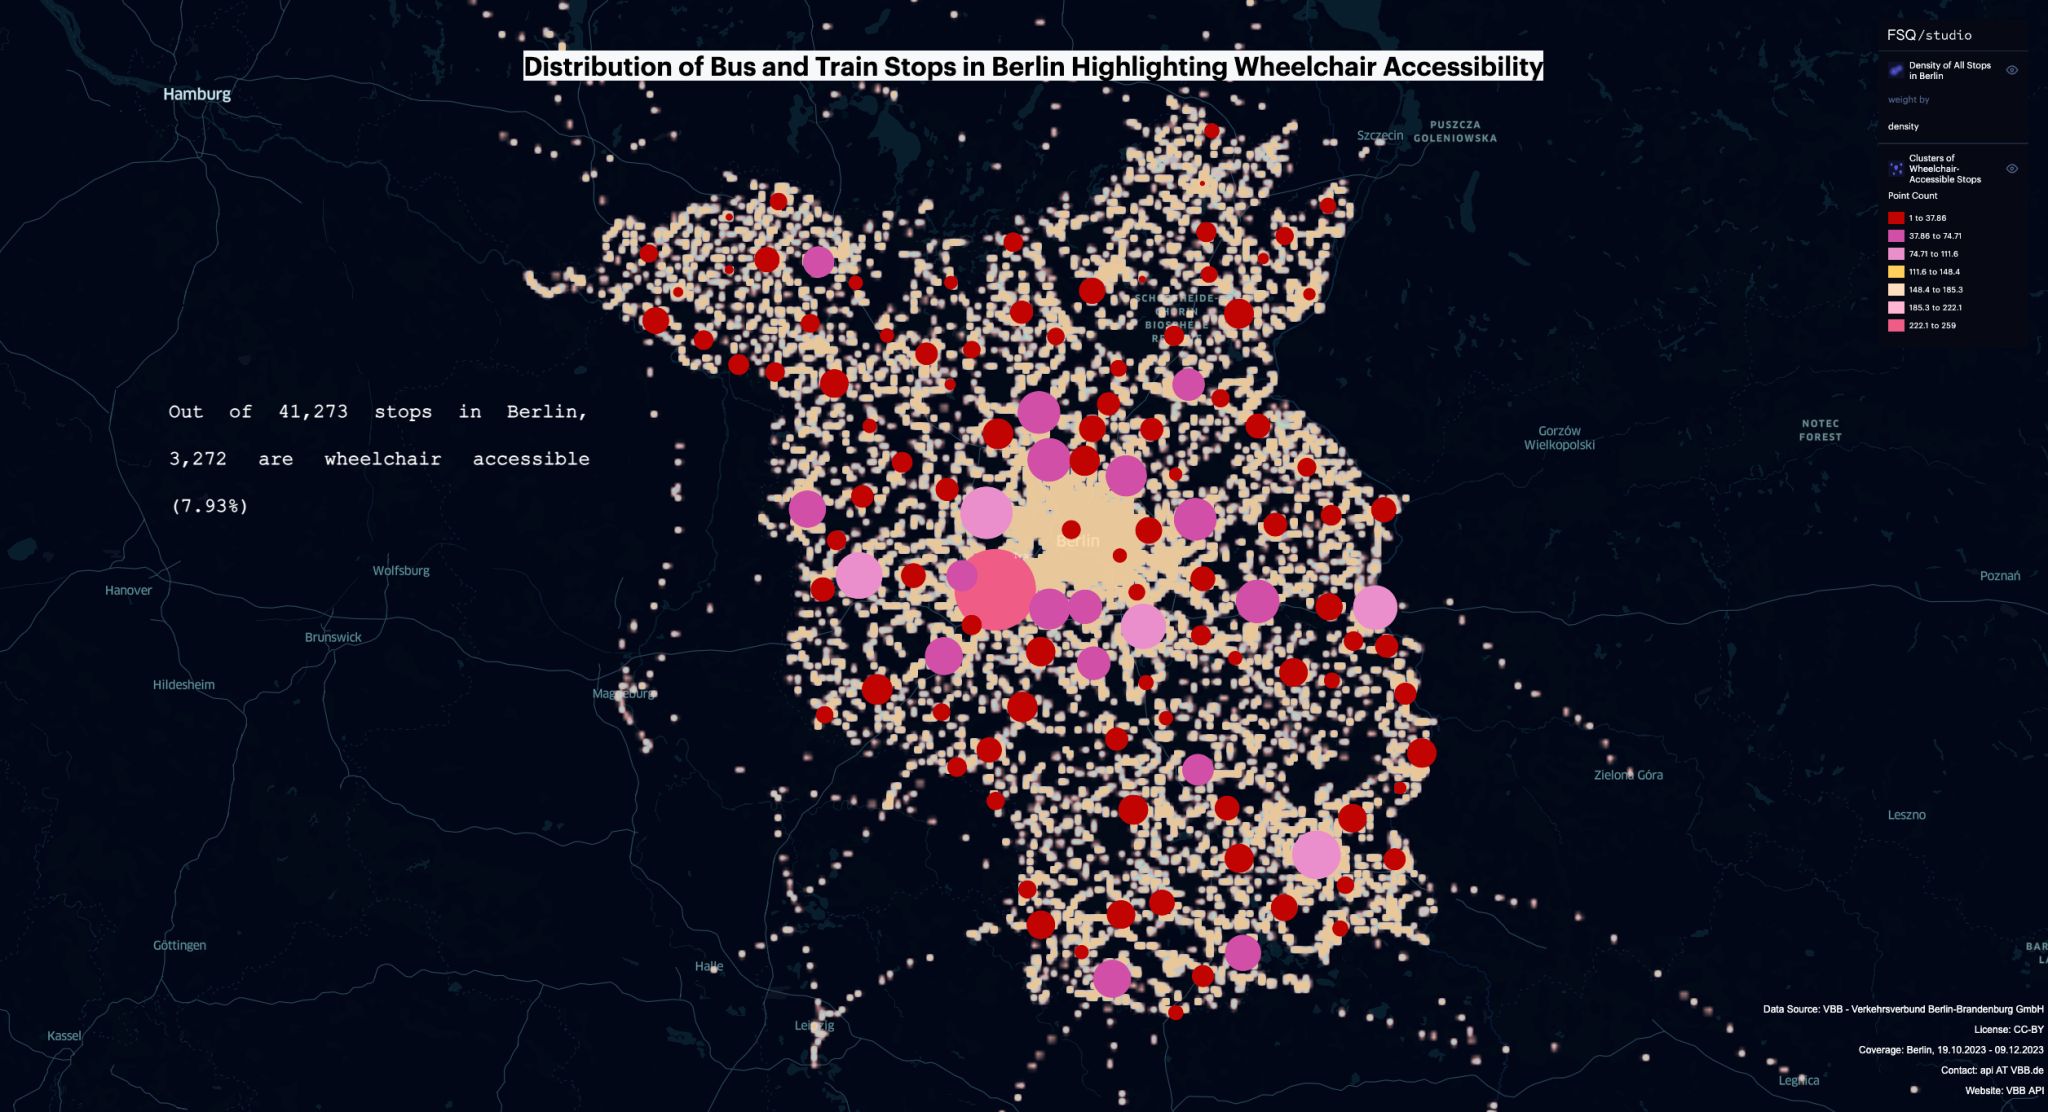
Berlin GTFS Wheelchair Accessibility
GTFS-based visualisation of Berlin transit stop density and wheelchair-accessible stop clusters using QGIS and Foursquare Studio.
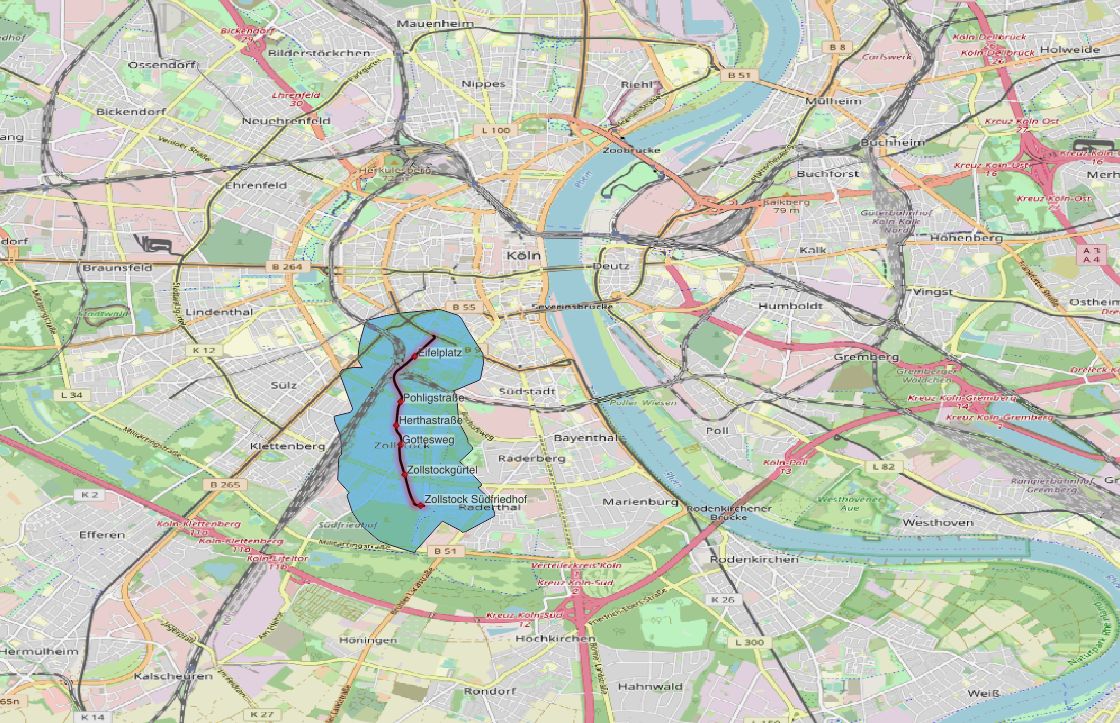
Cologne Tram Isochrones
Network-based isochrone analysis showing real travel-time catchments from tram stops across Cologne.
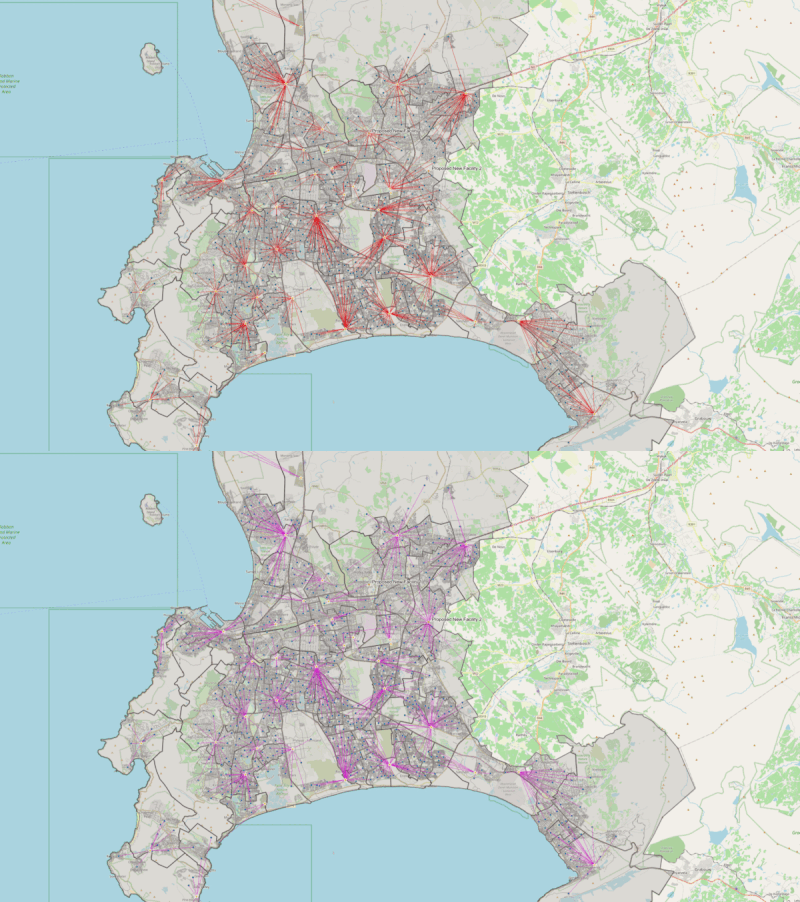
Cape Town Waste Location-Allocation
Location-allocation modelling to optimise waste facility placement across Cape Town using network analysis.

QGIS Tips & Tricks
A simple collection of my QGIS workflow posts linked directly to LinkedIn.
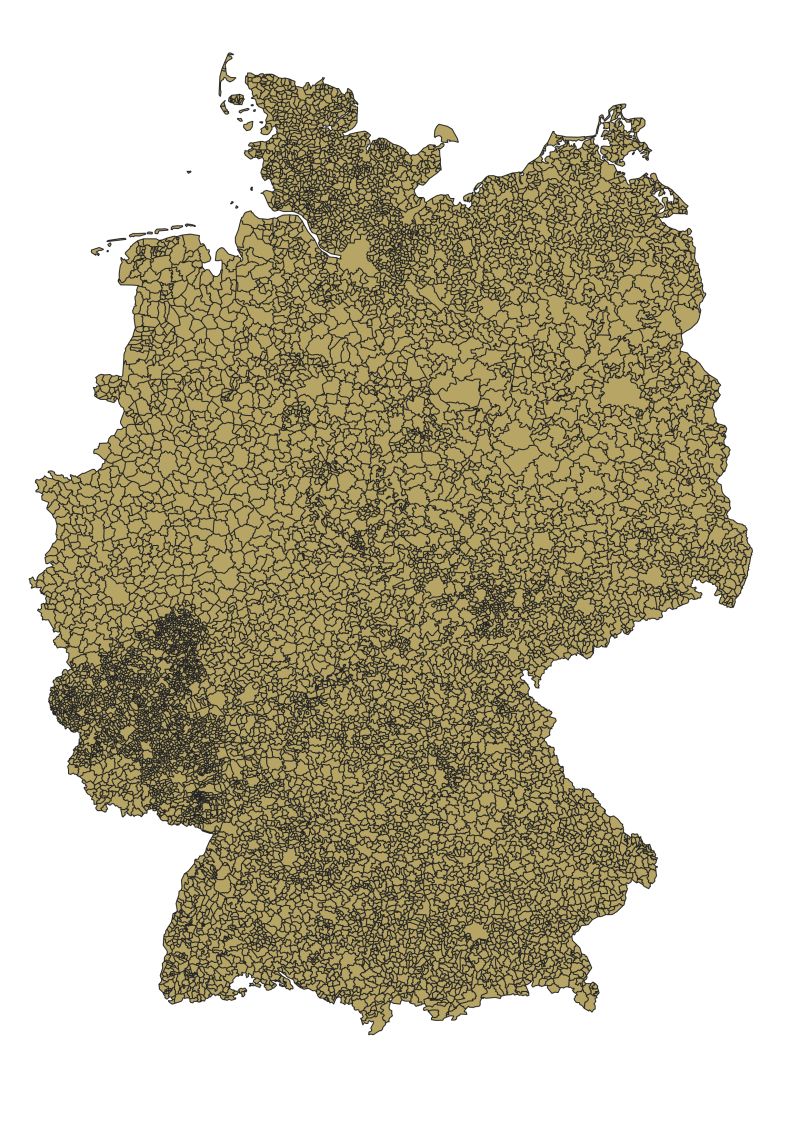
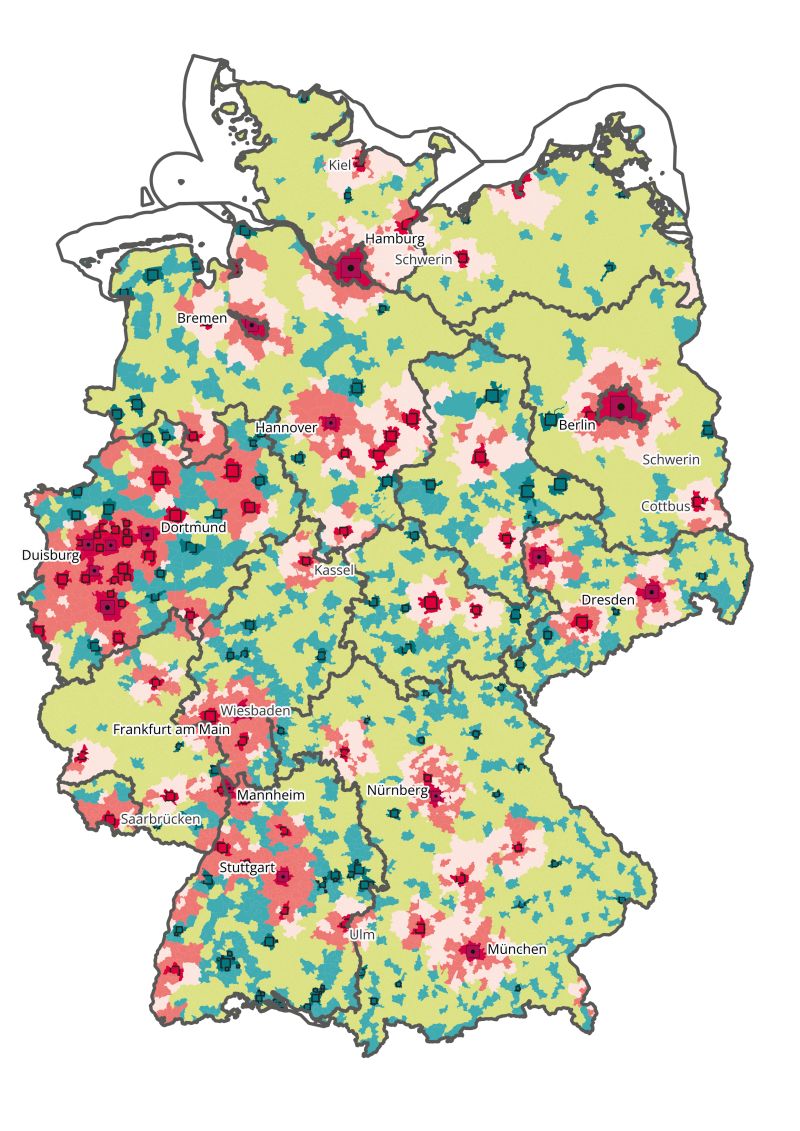
QGIS Geometry Generator — RegioStar
Custom QGIS geometry generator expressions for visualising RegioStar regional classification data.
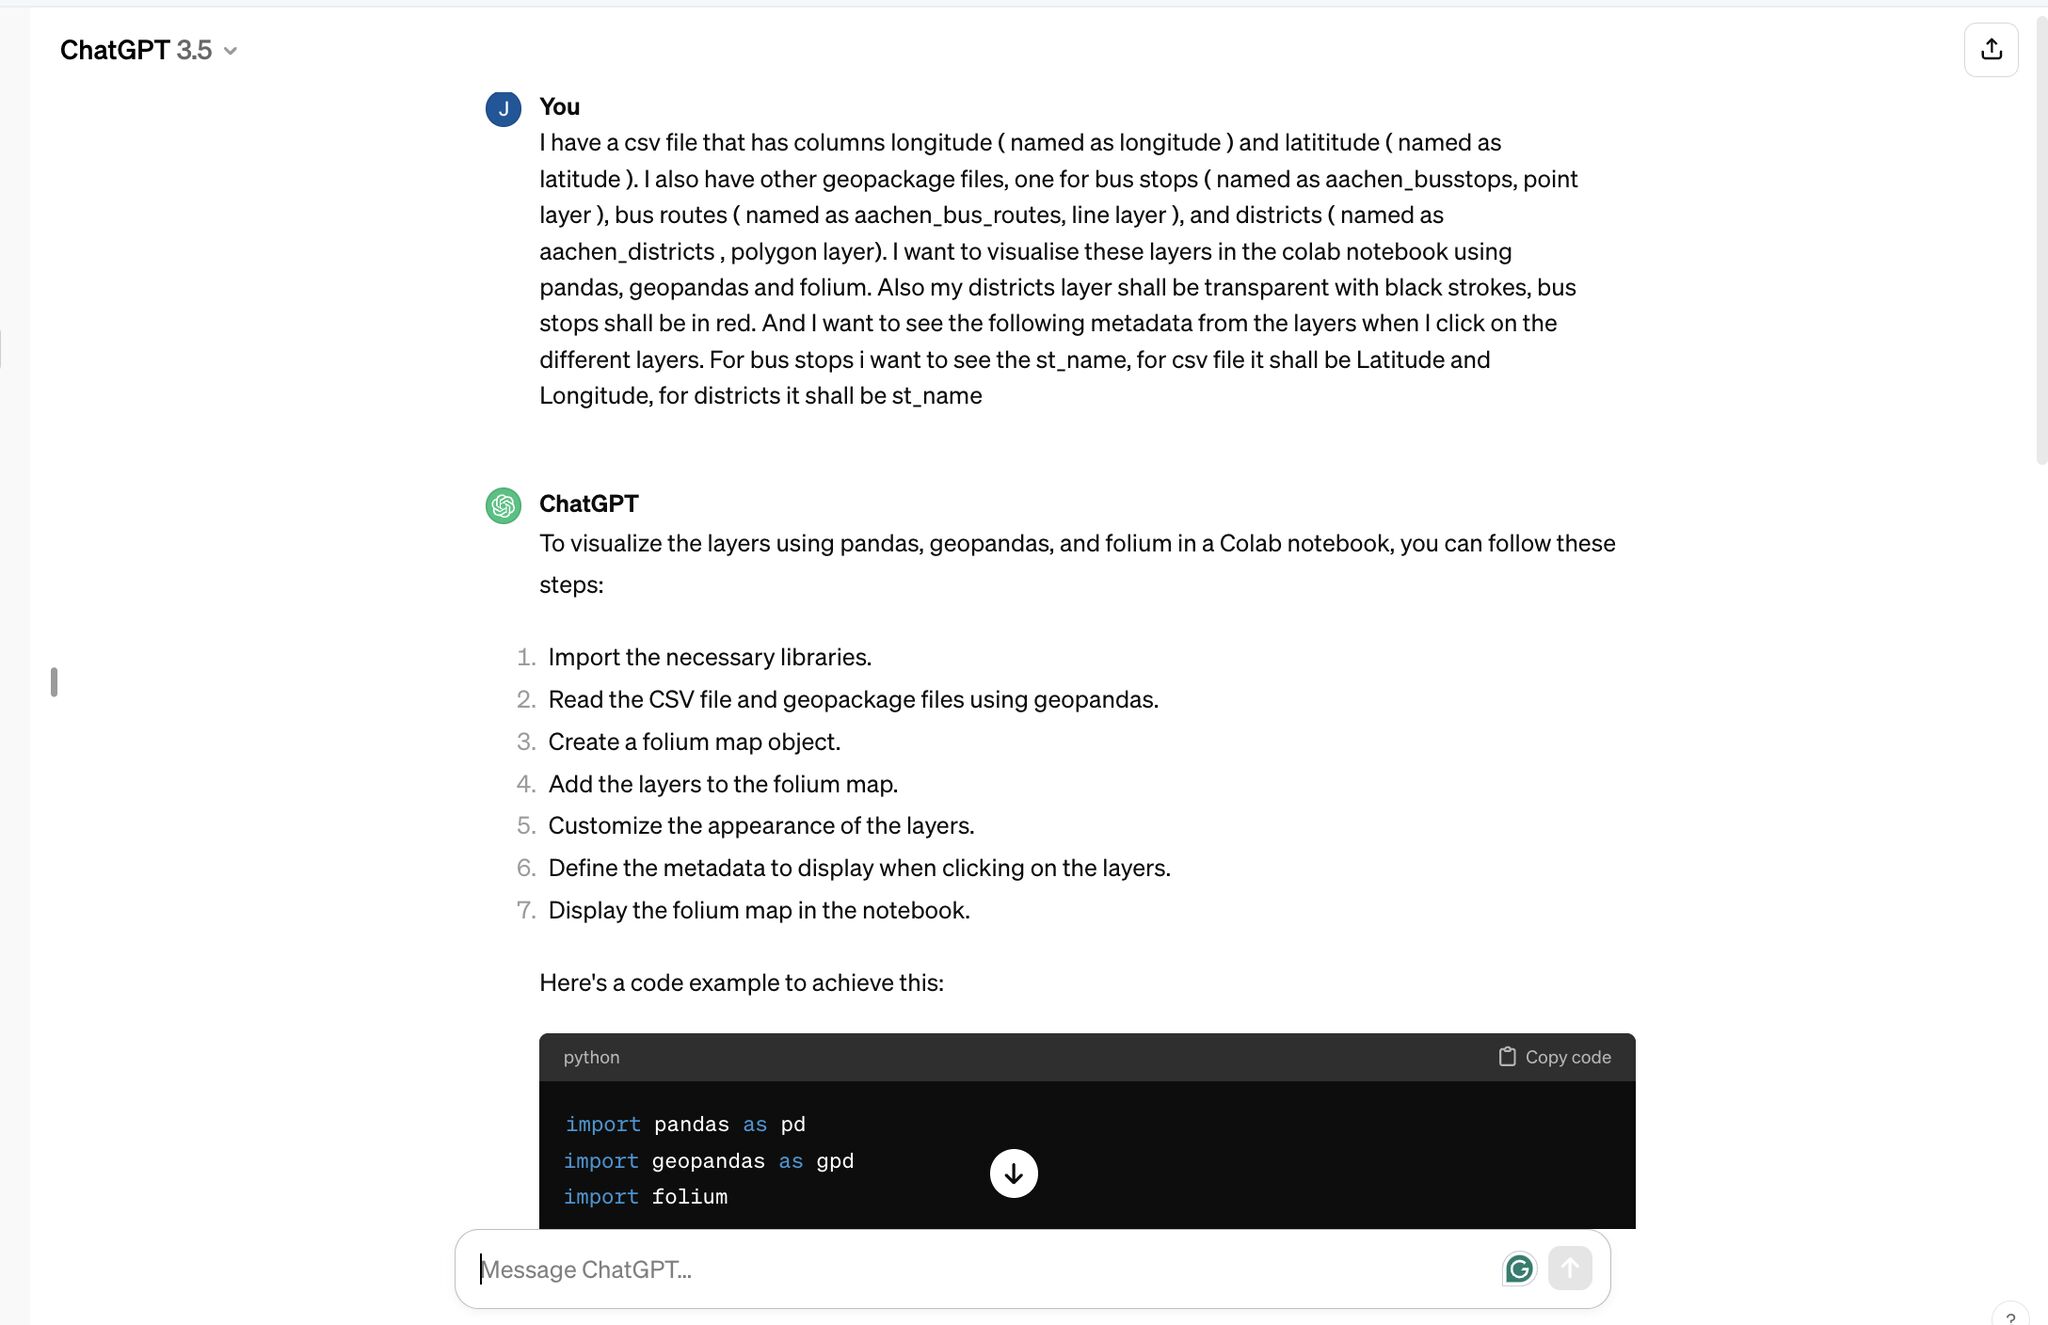
Python Spatial Analysis — Bus Stops
Python-based spatial analysis of bus stop coverage and accessibility using GeoPandas and OSM data.
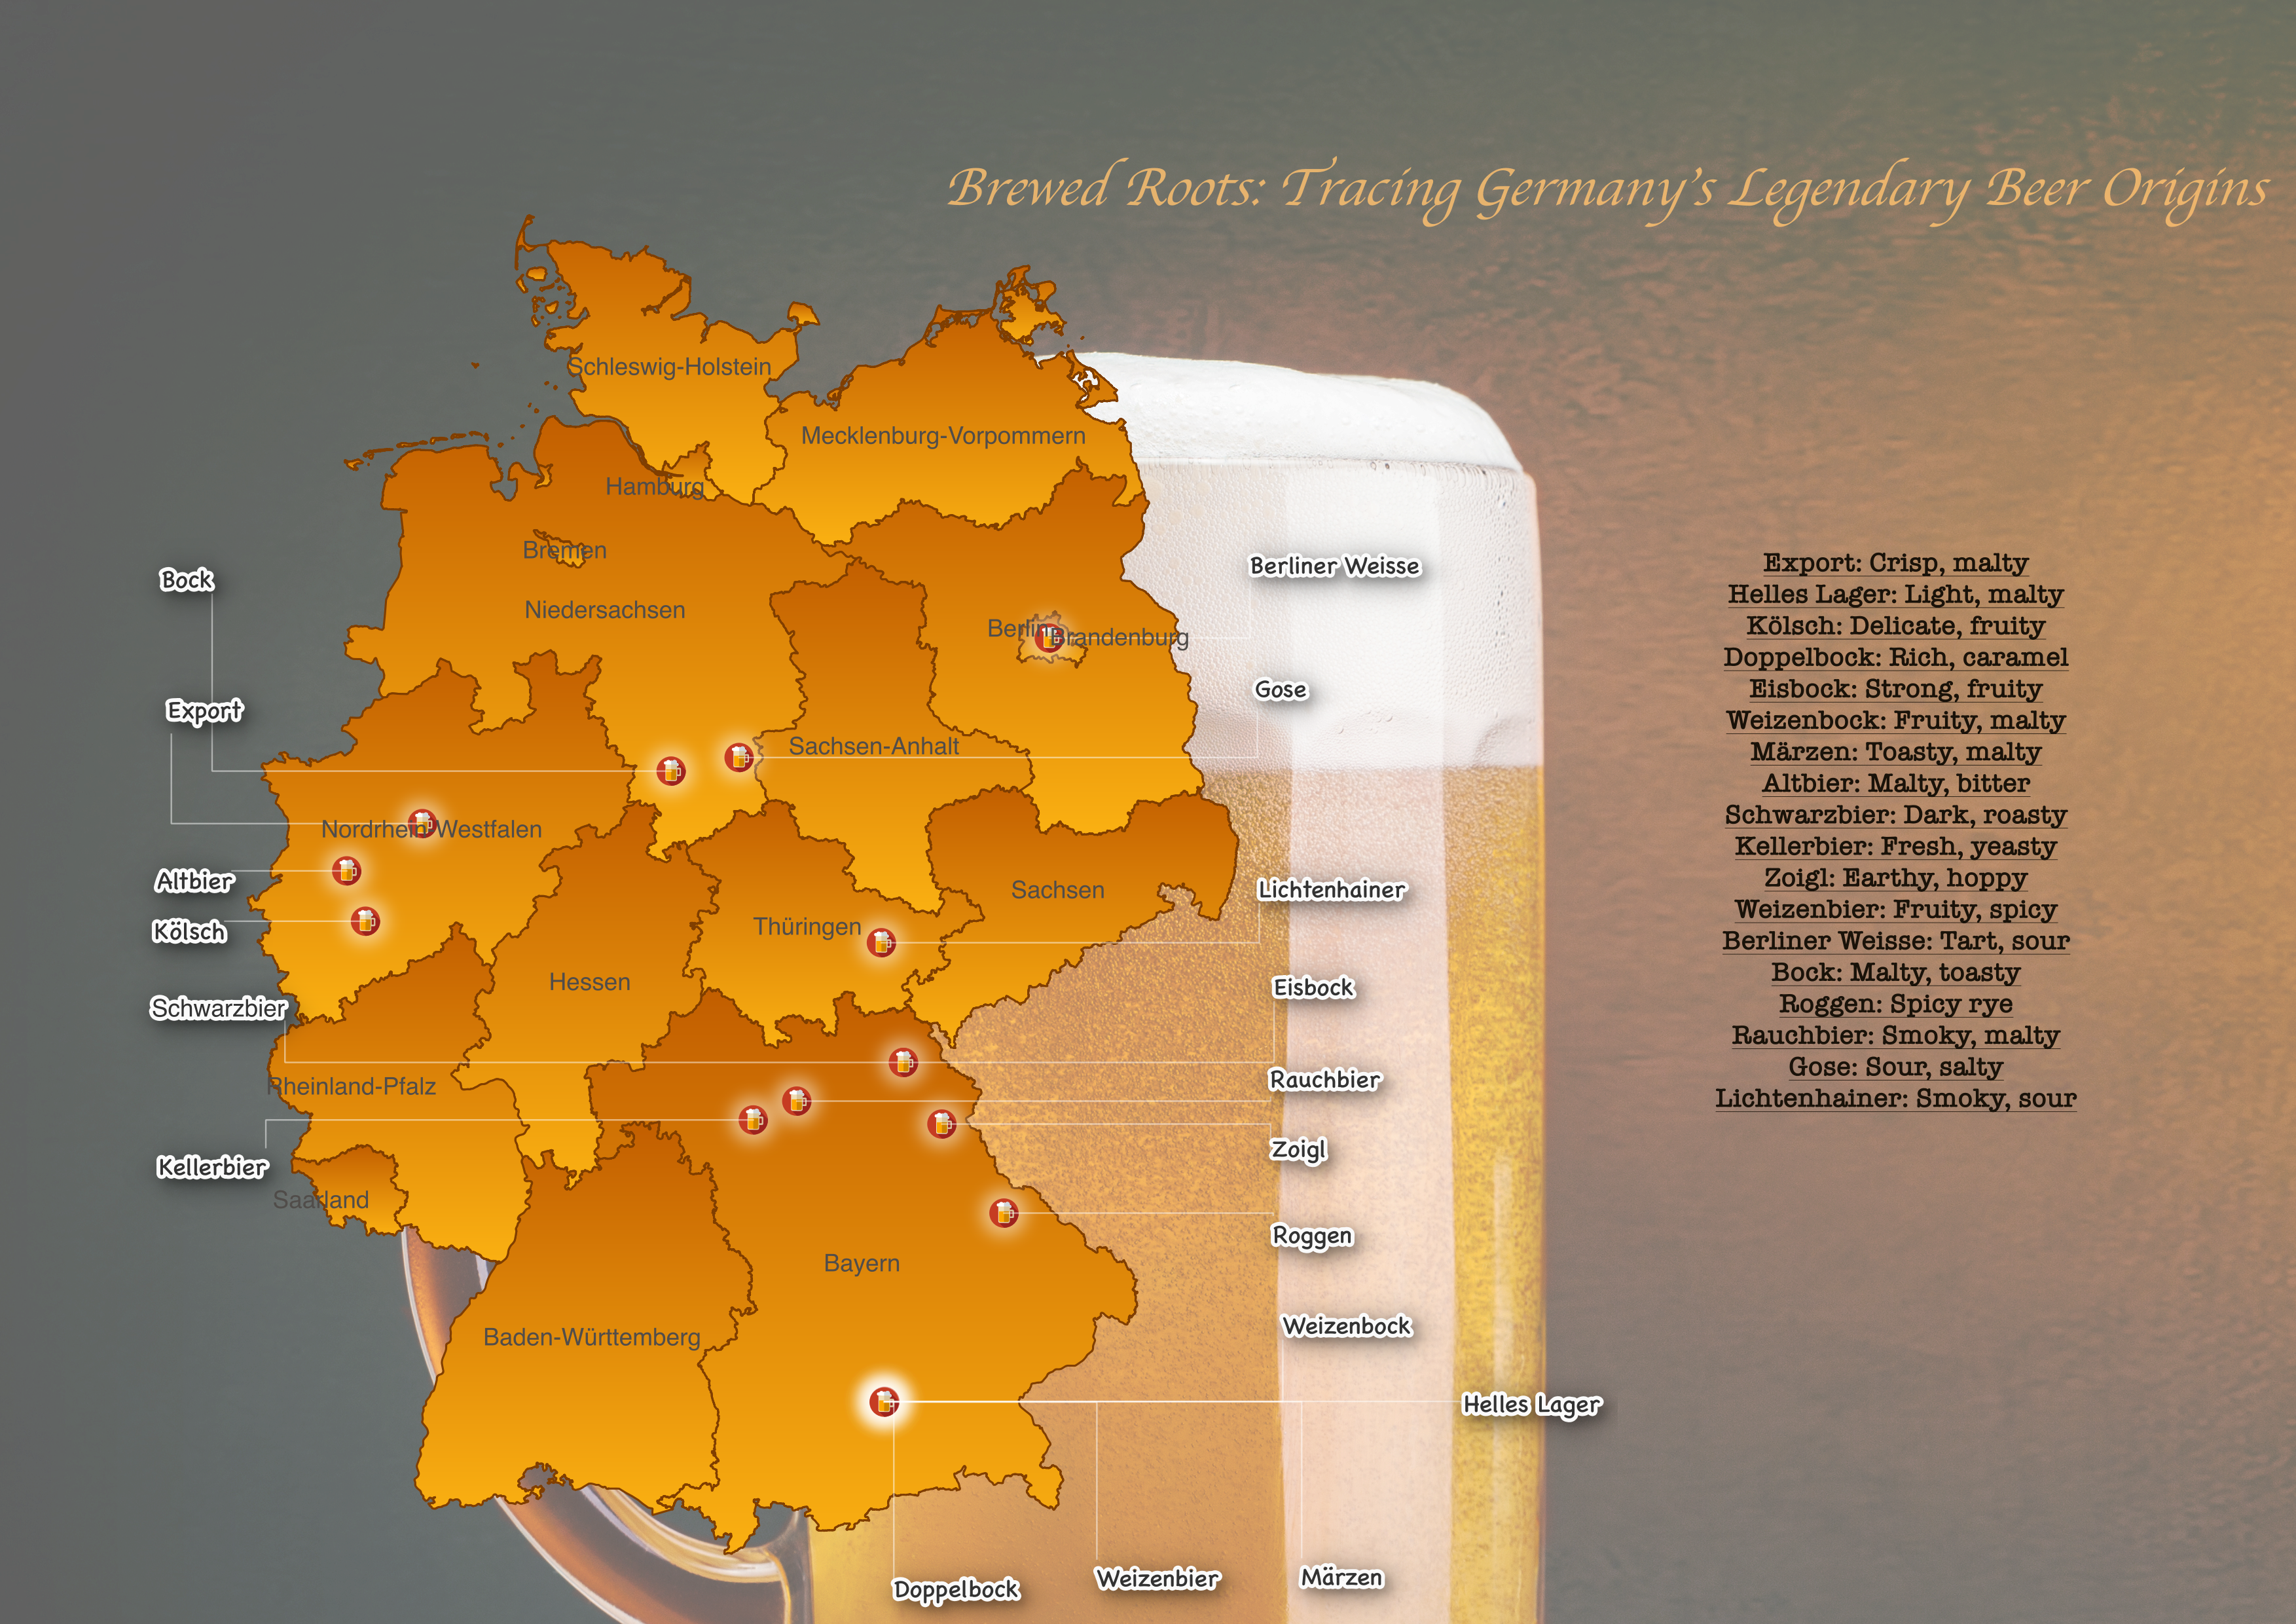
30 Day Map Challenge 2023 & 2025
Maps produced for the #30DayMapChallenge across 2023 and 2025 — diverse themes, techniques and geographies.
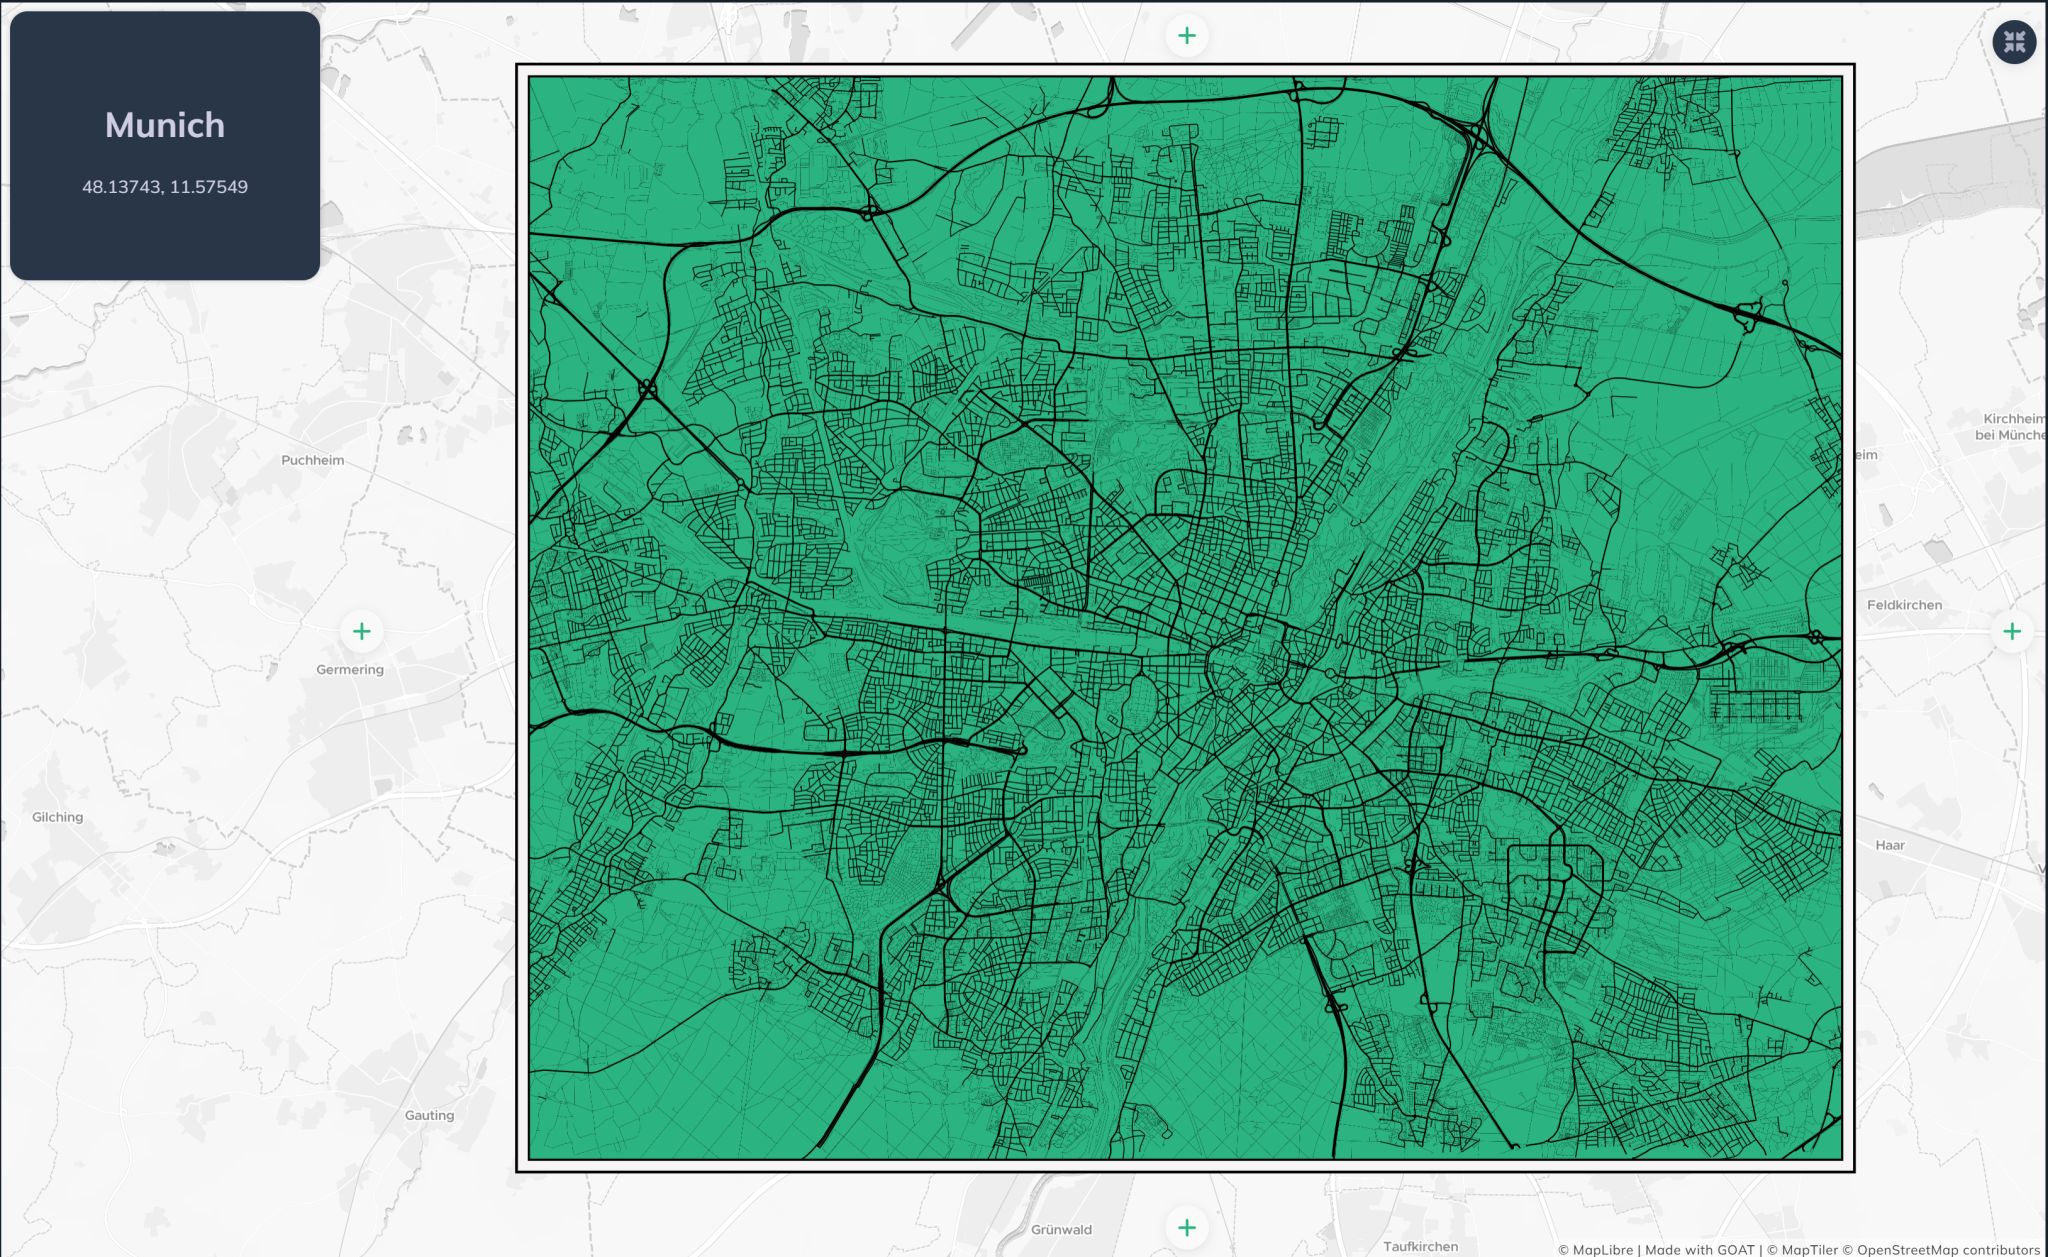
Munich — Minimalist Street Network
Day 14 of the #30DayMapChallenge — a minimalist map of Munich's street network using only OpenStreetMap data via GOAT.
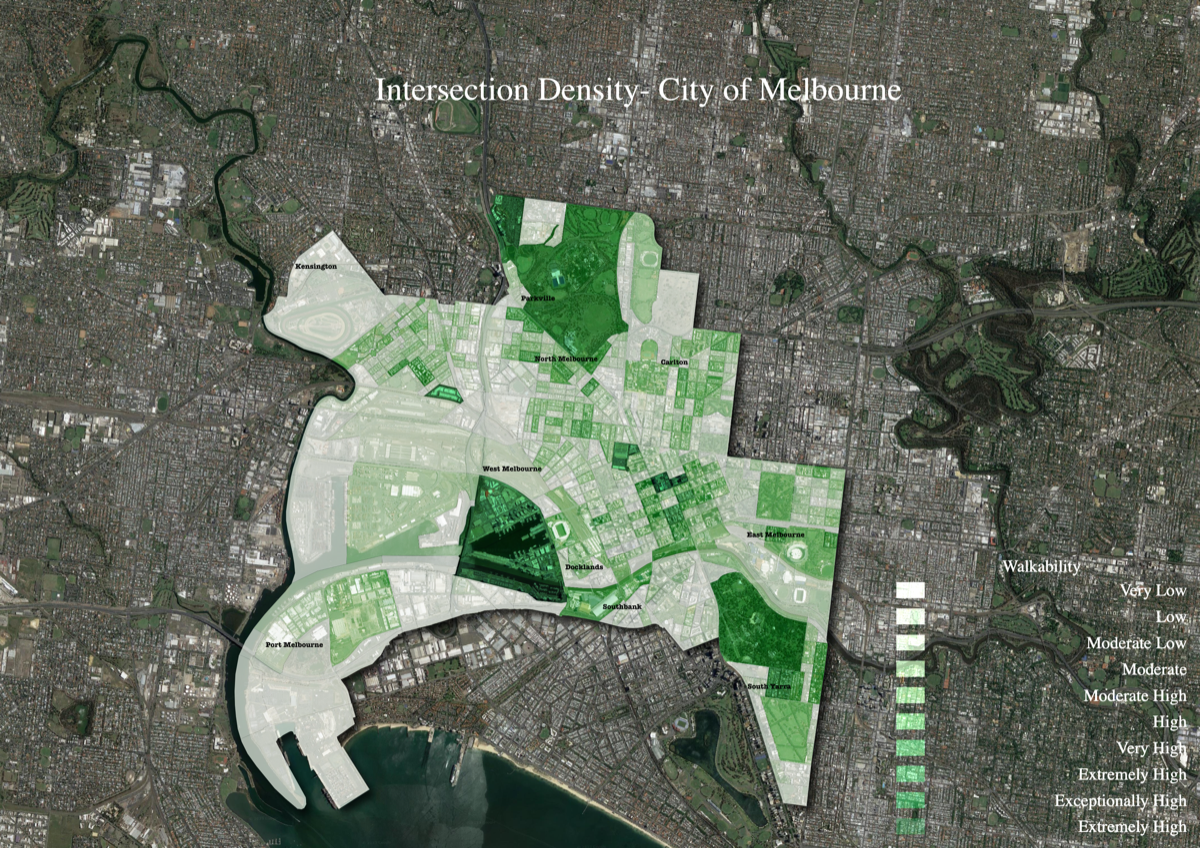
Melbourne Walkability — Intersection Density
Intersection density analysis for Melbourne using pedestrian network and CLUE land use data from the Melbourne Open Data Platform.
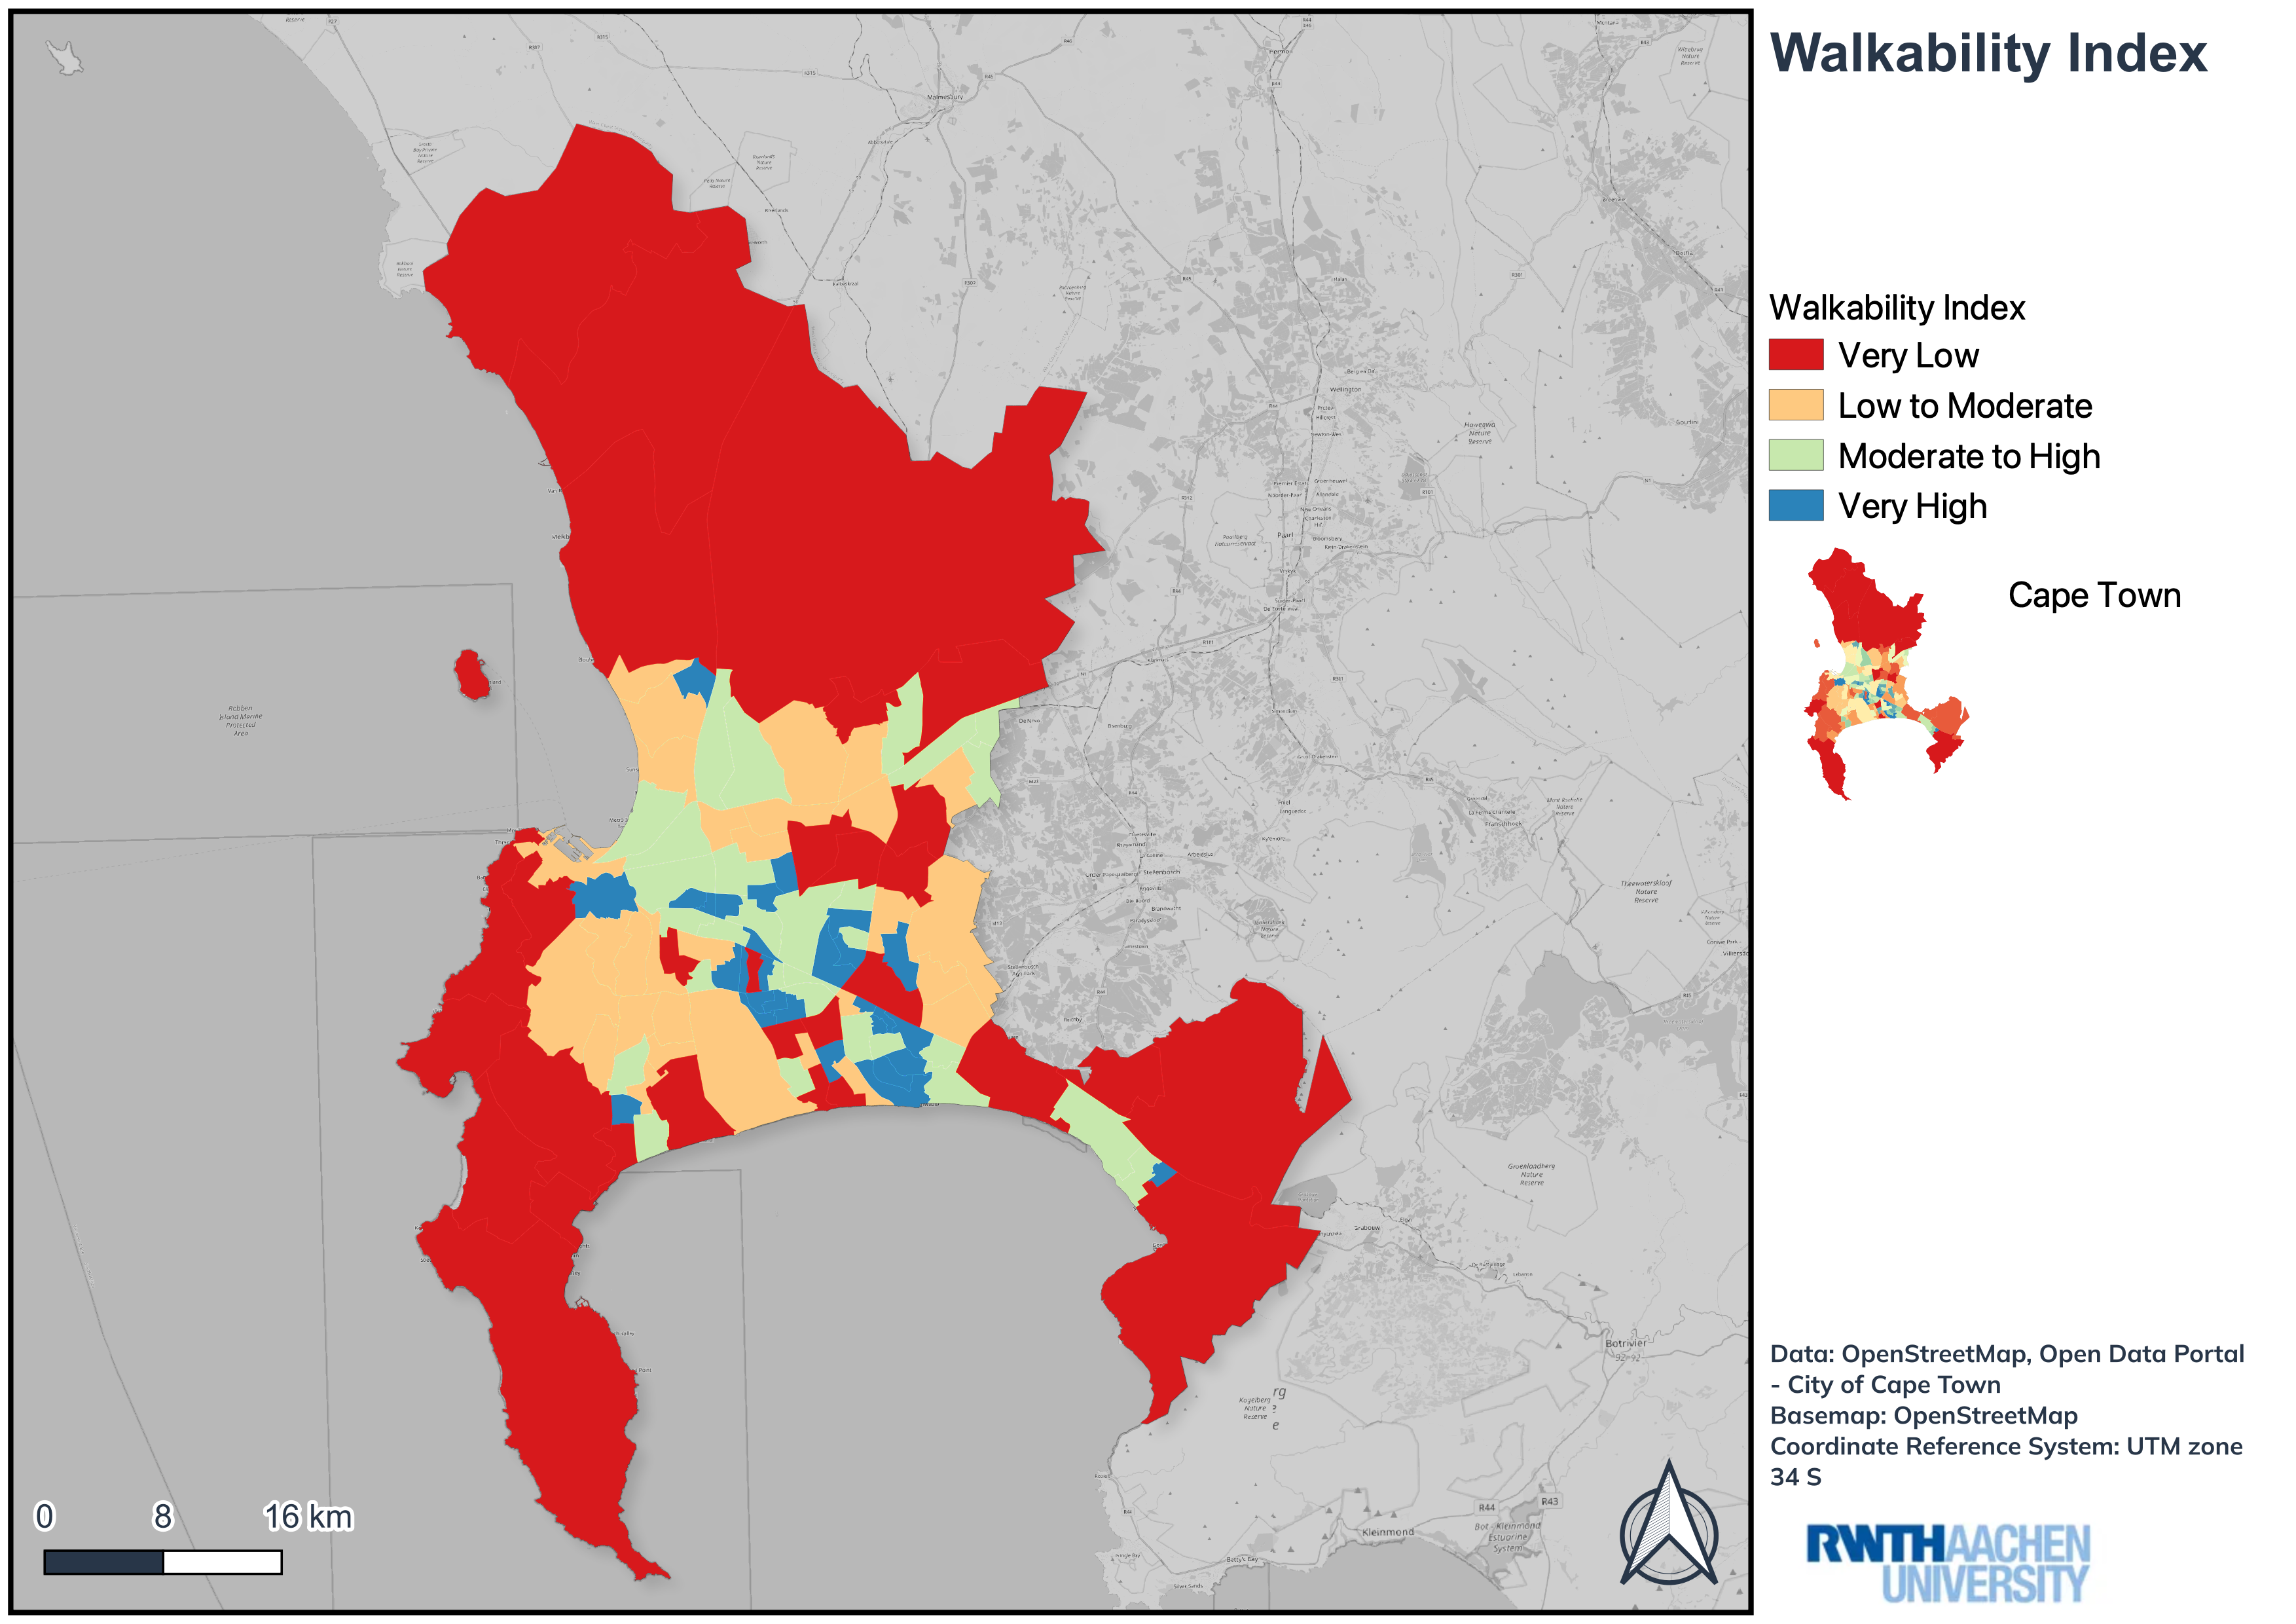
Cape Town Walkability
QGIS-based walkability index for Cape Town, developed for the Mobility Research and Transport Modelling course at RWTH Aachen.
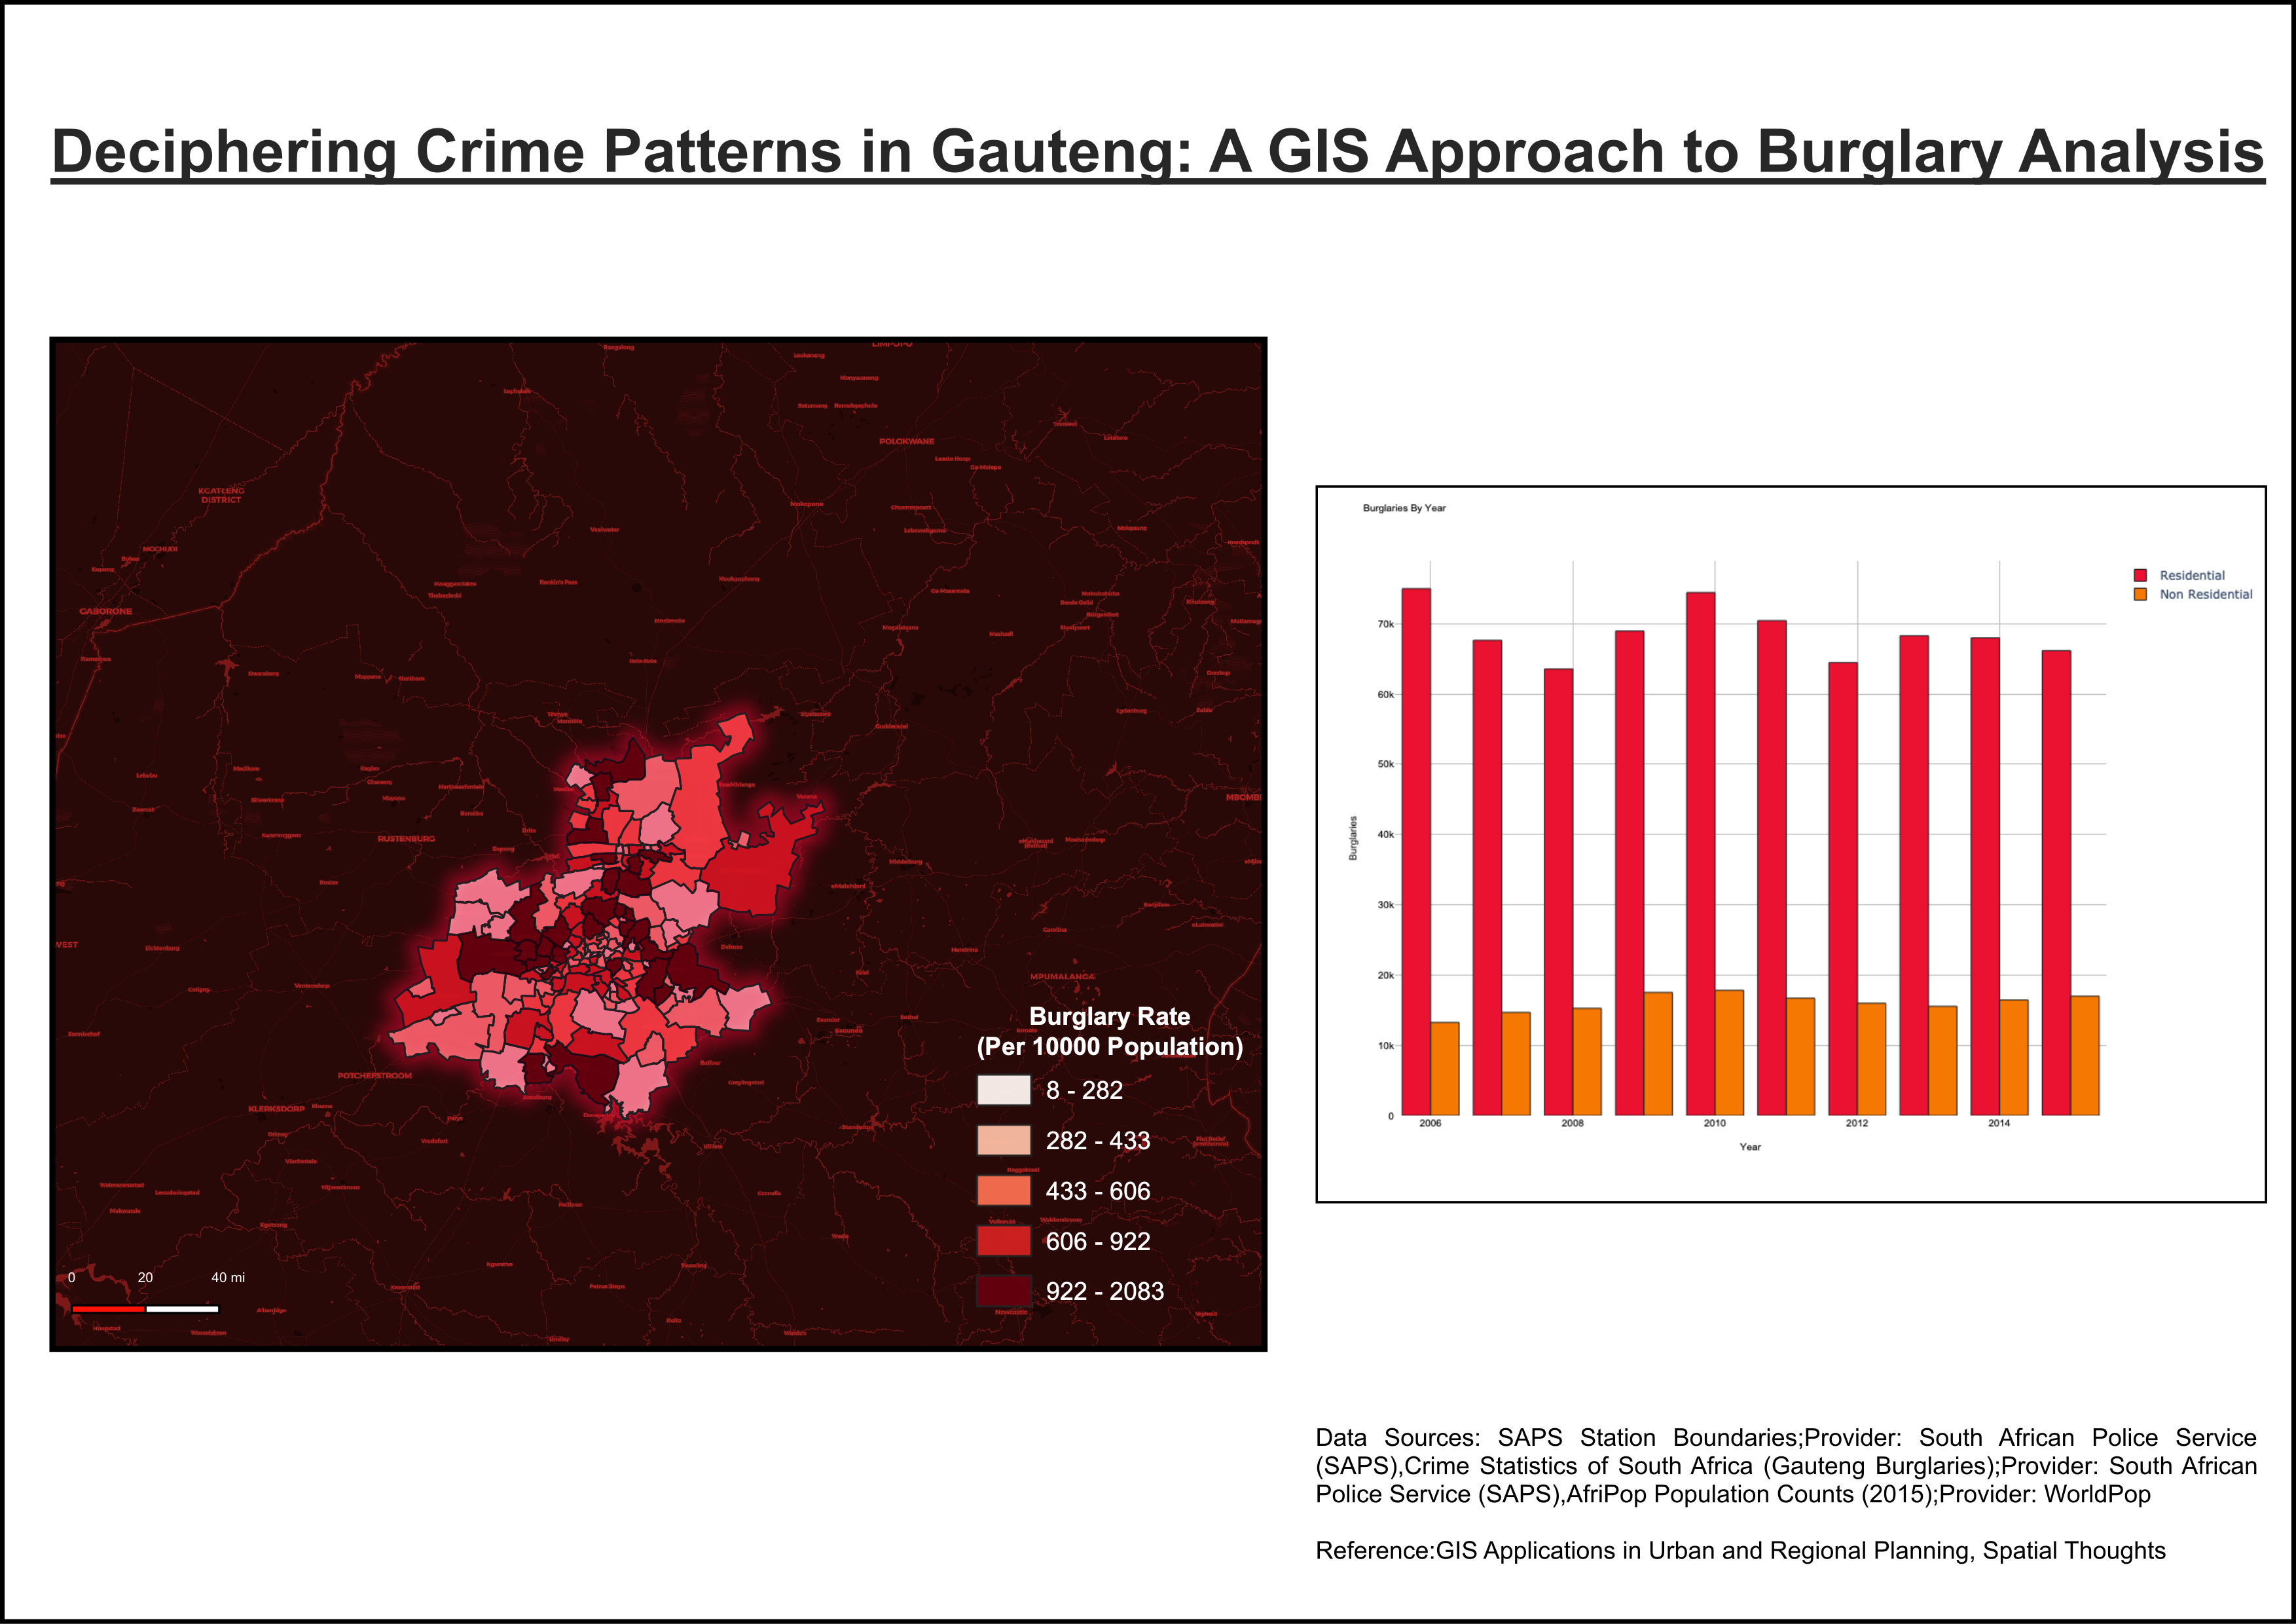
Burglary Rate in Gauteng
Crime-rate mapping per 10,000 population using SAPS statistics, AfriPop population counts and QGIS zonal analysis.
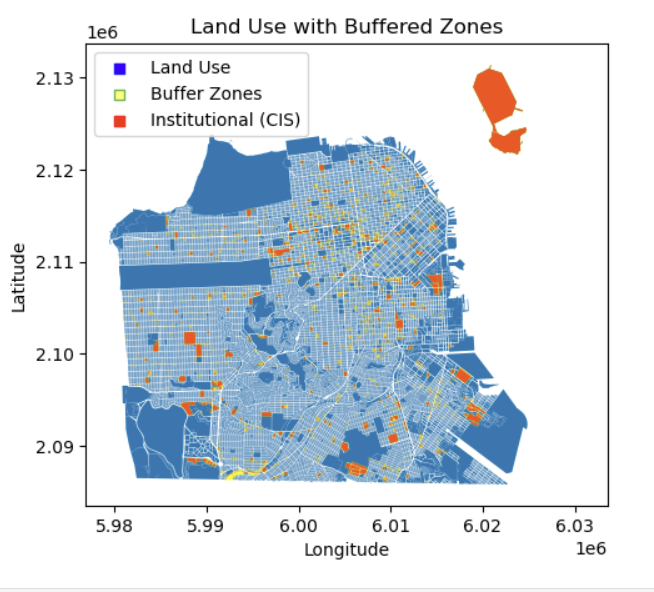
Urban Planning Buffer Analysis — San Francisco
Buffer zones around institutional land use areas in San Francisco using GeoPandas and Matplotlib, with an interactive Foursquare Studio map.
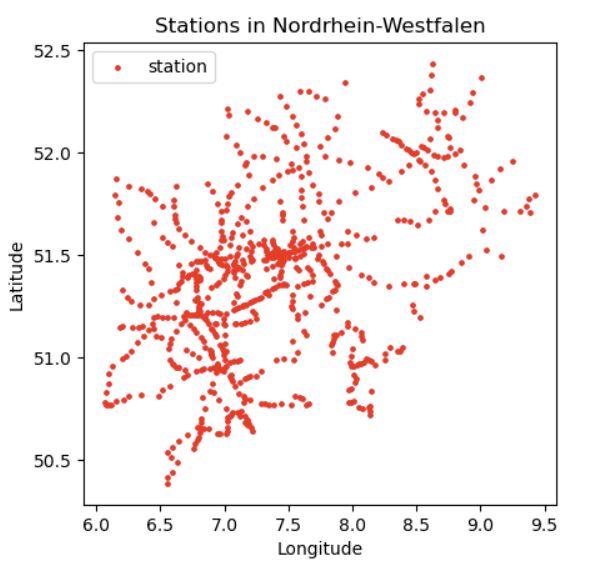
NRW Railway Stations — Python & Deutsche Bahn API
Fetching live railway station data via the Deutsche Bahn WEB API and visualising station lines using GeoPandas and Pandas.
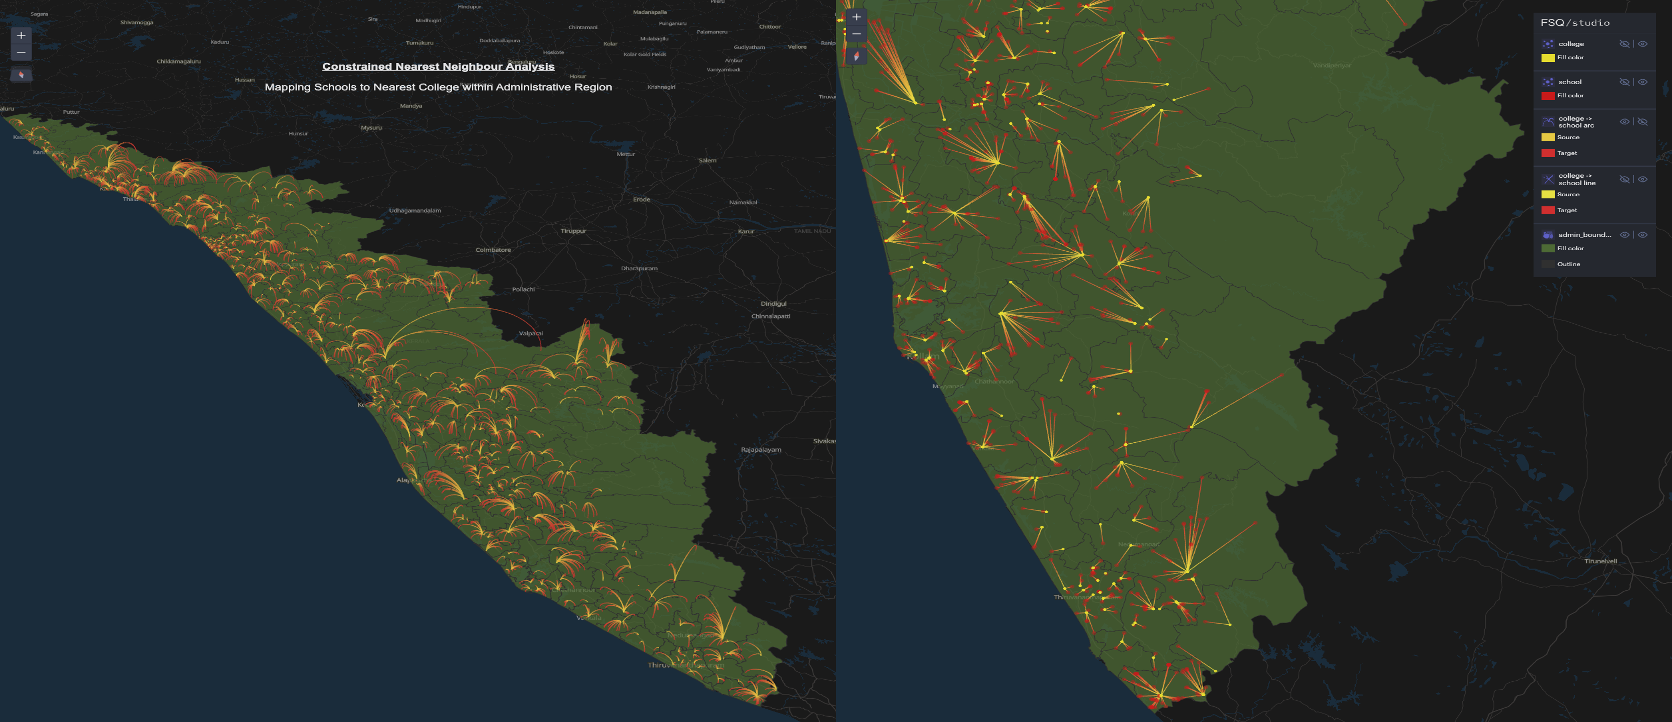
School-to-College Proximity — Kerala
#SpatialAnalysisChallenge entry: proximity analysis between schools and nearest colleges within administrative regions of Kerala using QGIS expressions.
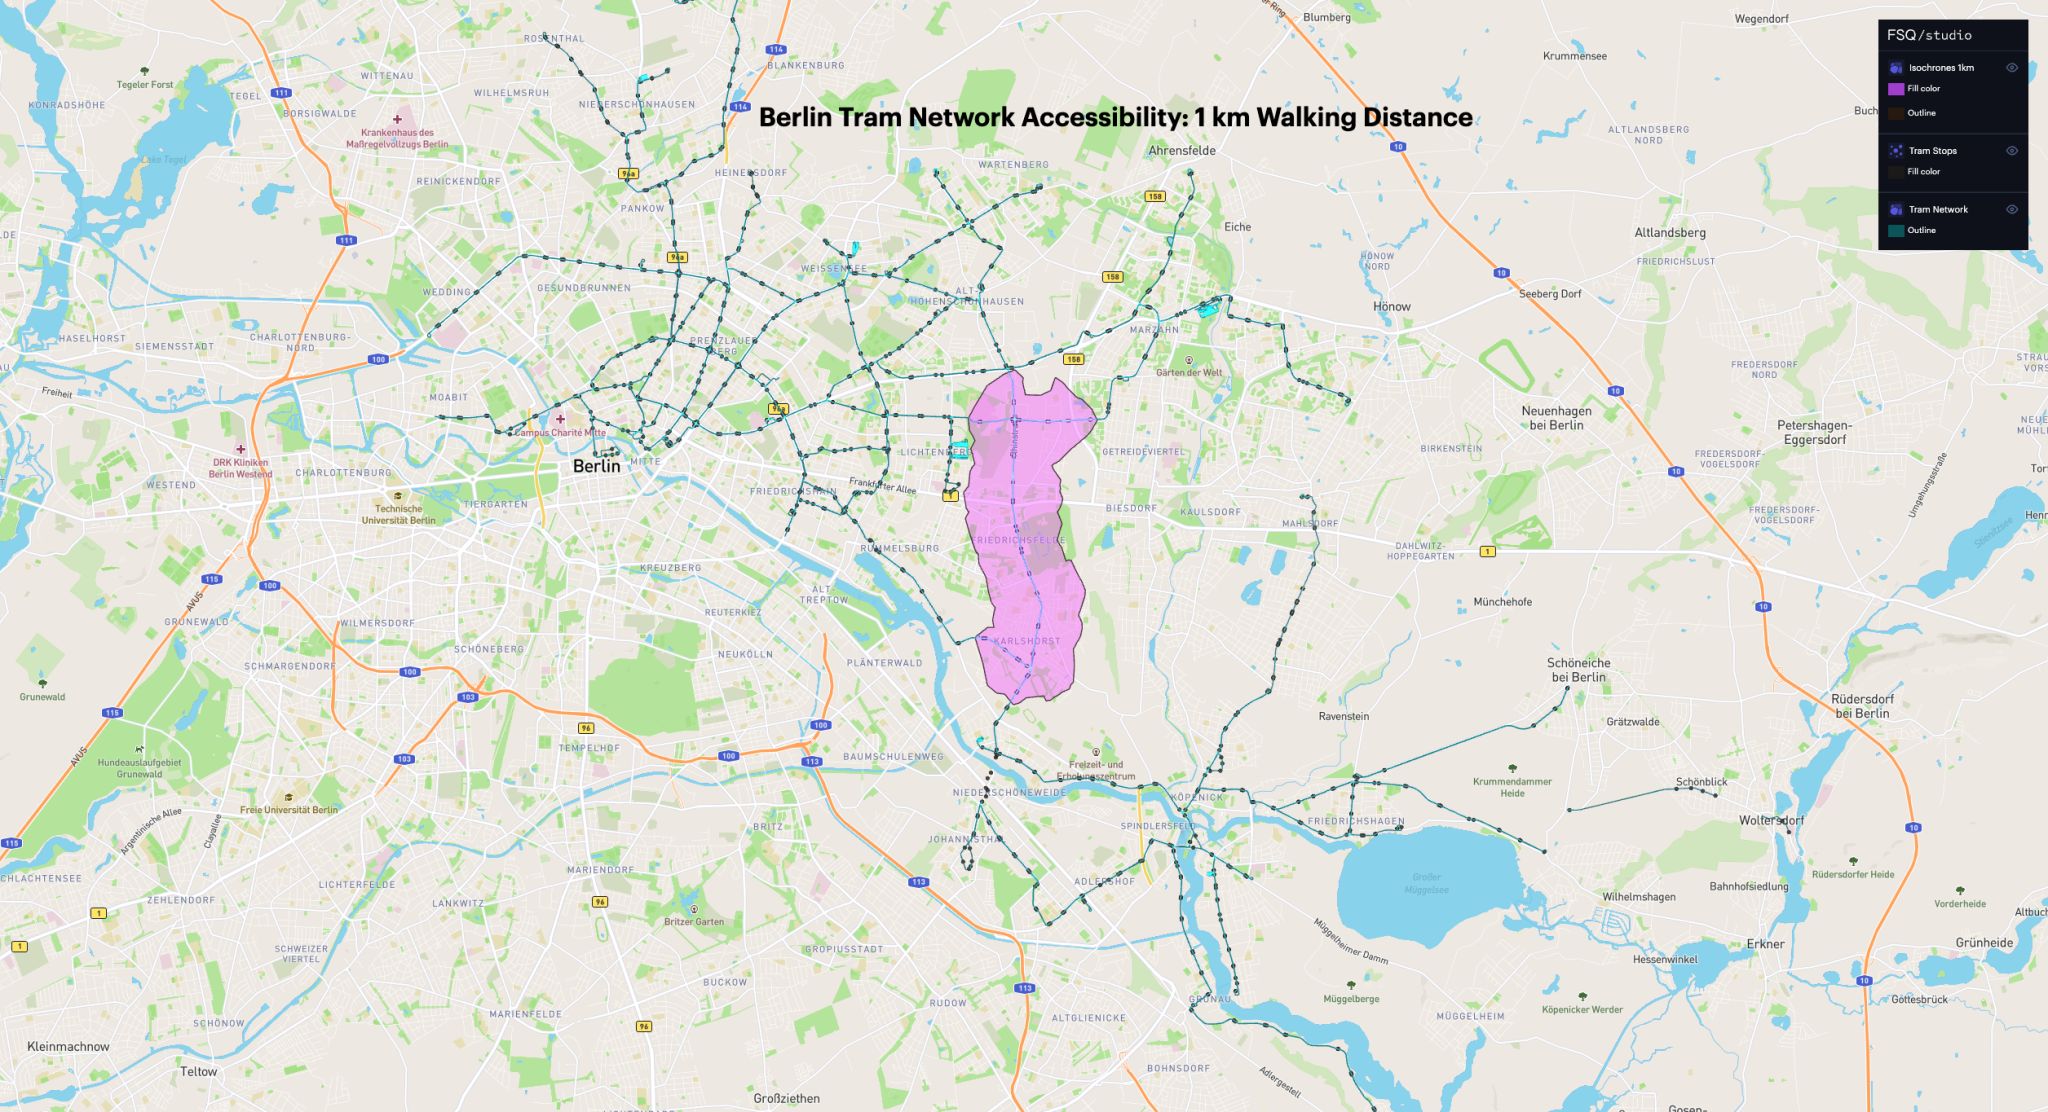
Berlin Tram Accessibility
Accessibility analysis of Berlin's tram network showing population coverage within walking distance of stops.
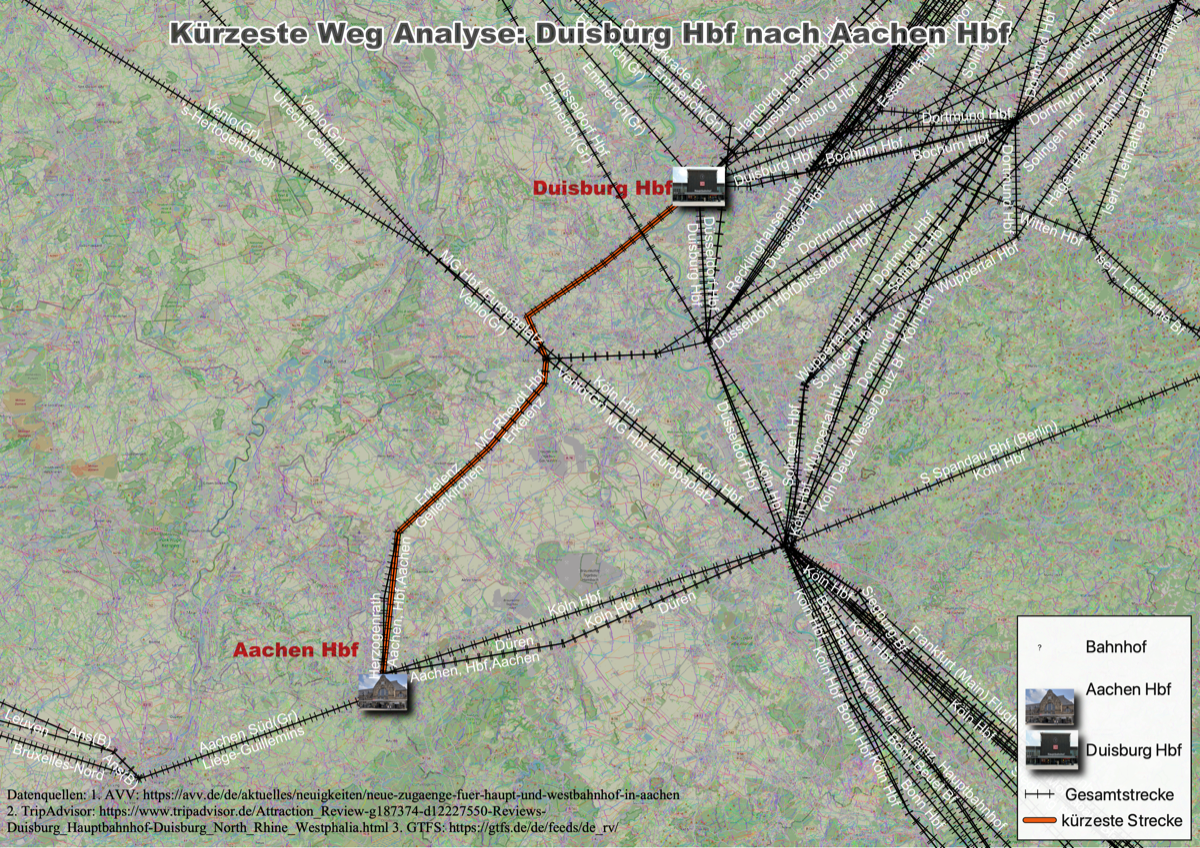
GTFS Analysis — Duisburg to Aachen
Processing and visualising GTFS feed data to analyse public transport connectivity between Duisburg and Aachen.
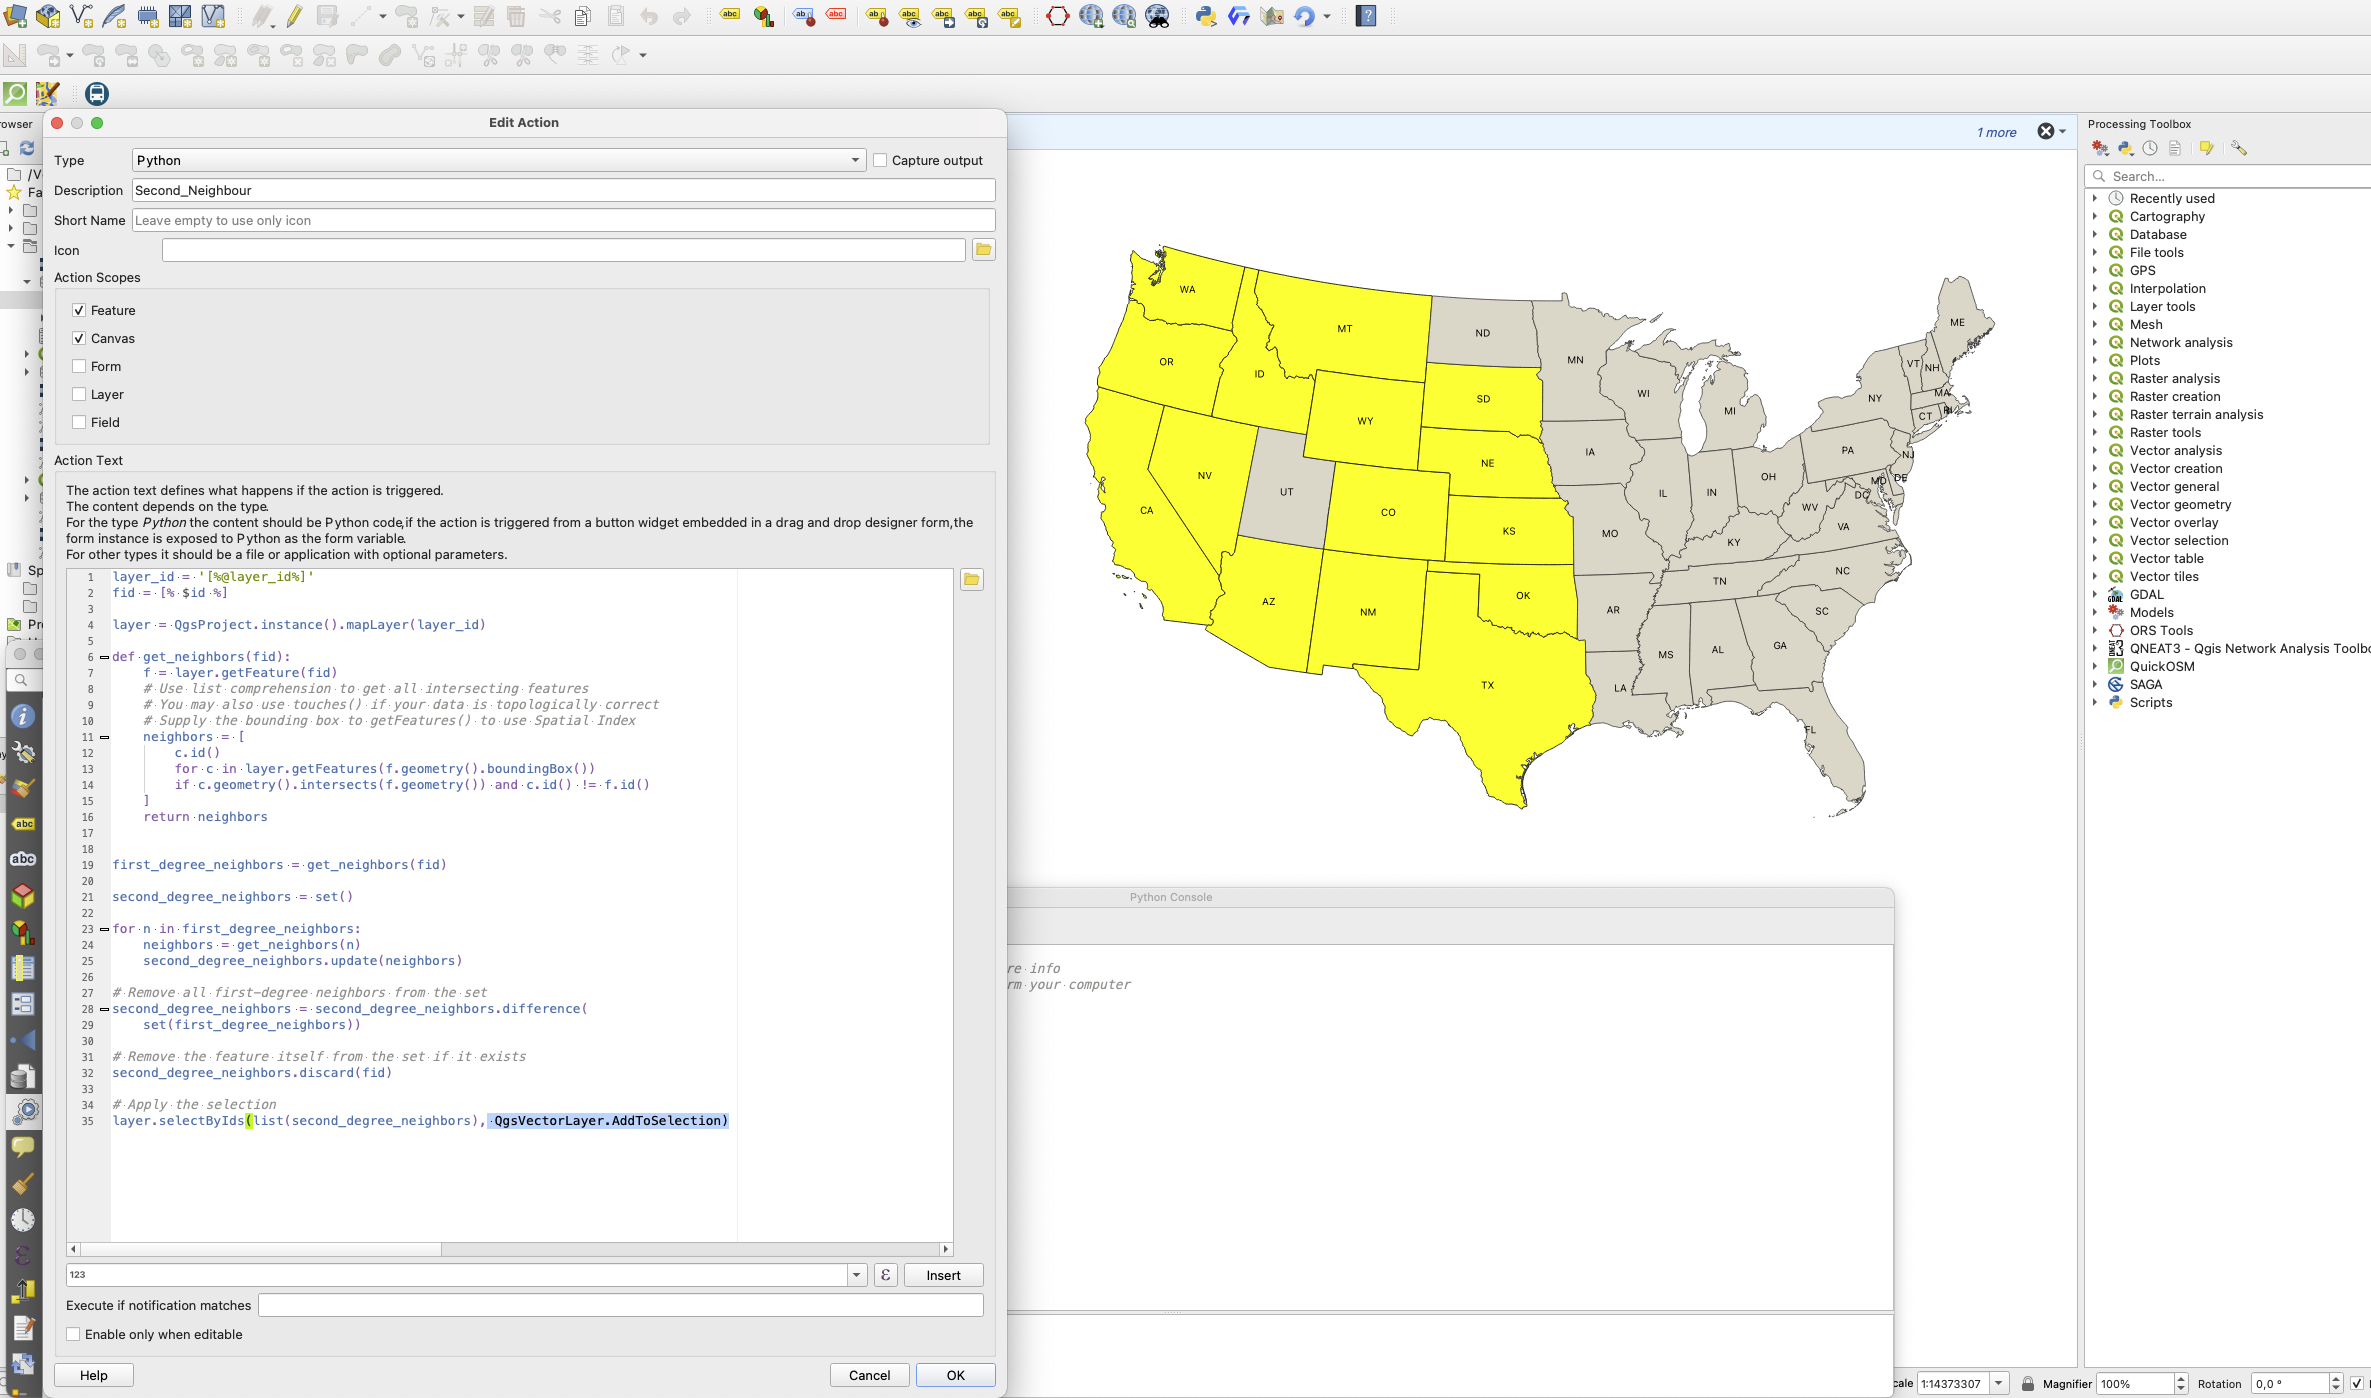
QGIS Actions — Neighbour Lookup
Custom QGIS Actions to enable interactive neighbour lookups and spatial queries from the map canvas.