Overview
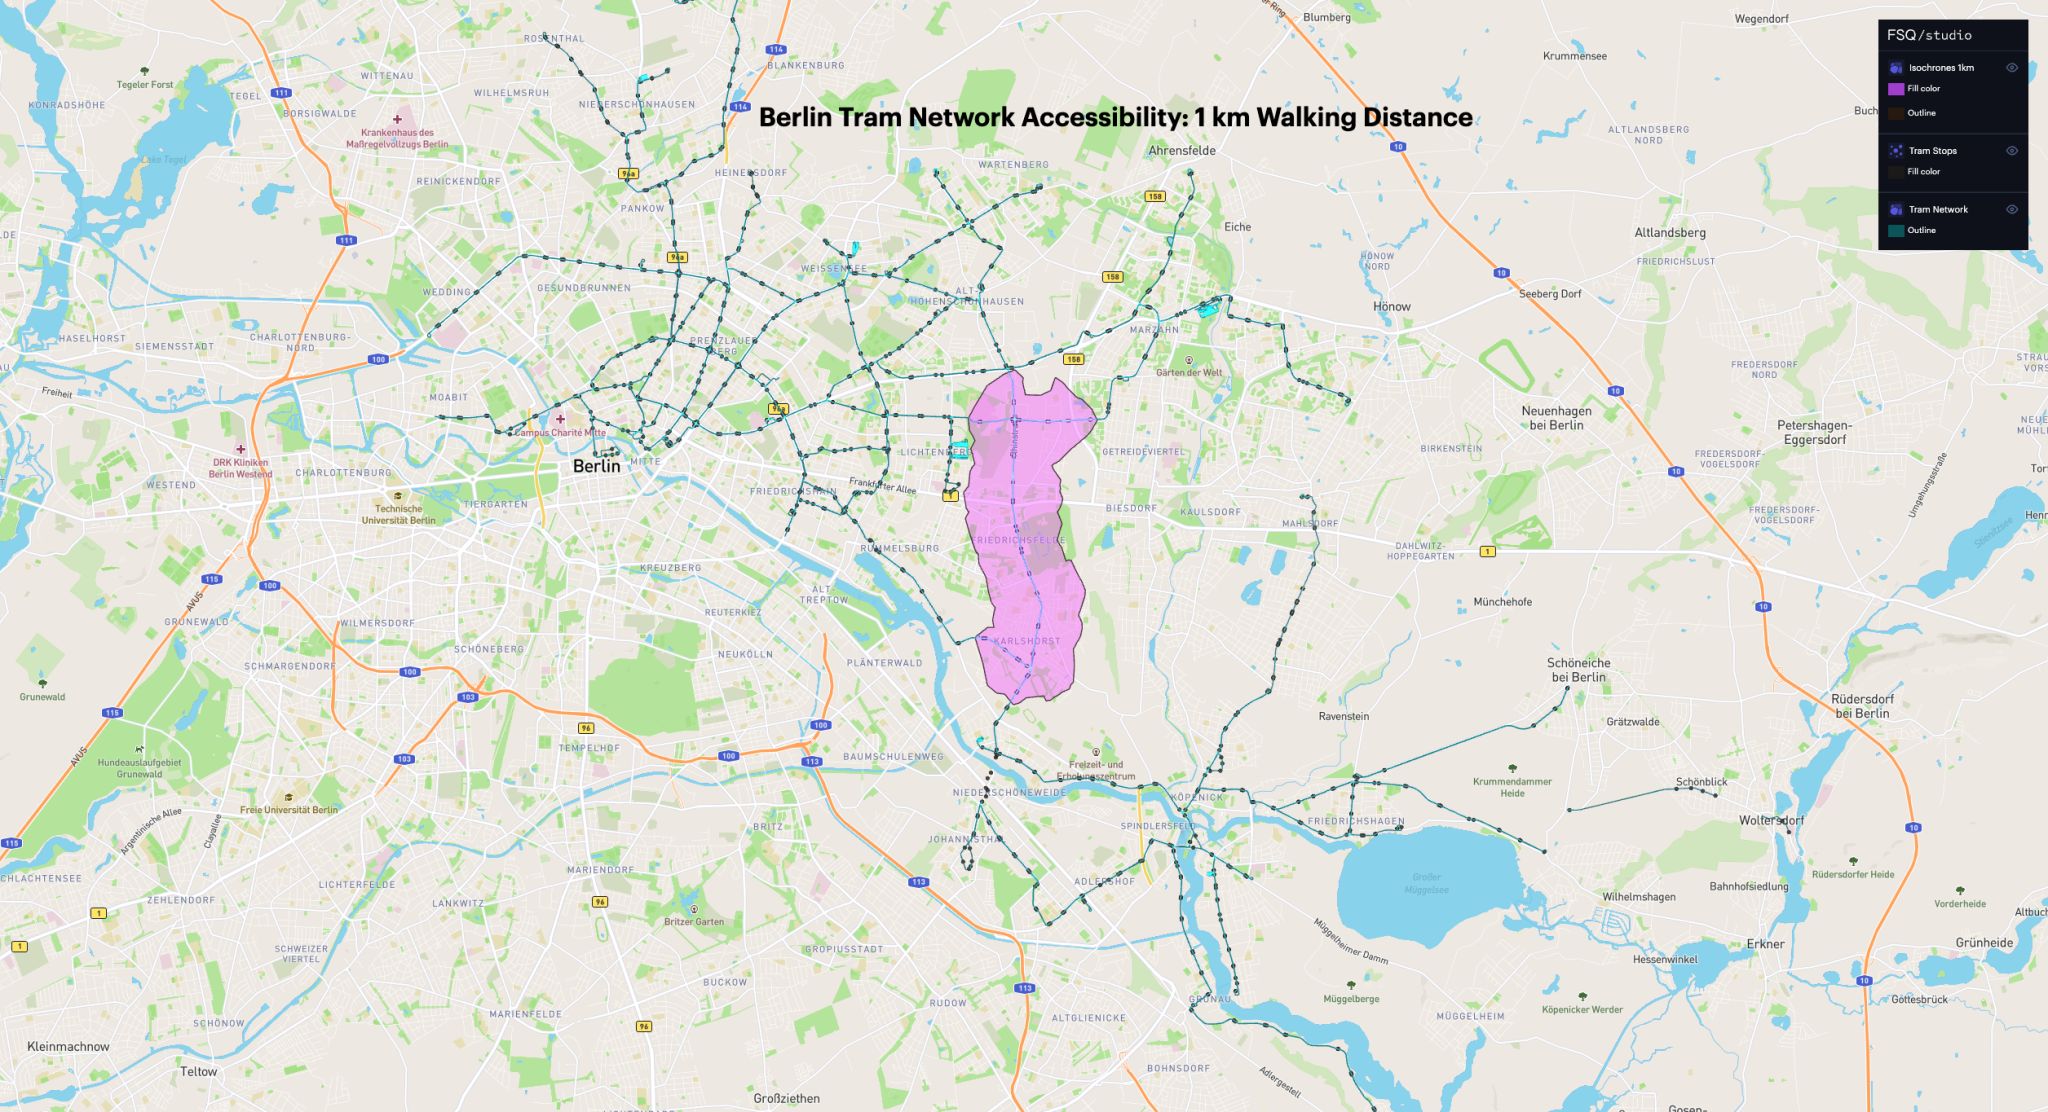
Day 7 of the #30DayMapChallenge — theme: Navigation. Using GTFS data from Berlin, this project conducts a transit accessibility analysis to help users understand how well-connected key parts of the city are to the public transport network.
The goal is to highlight areas accessible within a reasonable commuting distance from key transit hubs — useful for city planning, transportation optimisation, and improving accessibility for residents.
Methodology
GTFS Stop Extraction
Loaded Berlin's GTFS feed to extract transit stop locations, identifying key transit hubs across the city as origin points for the accessibility analysis.
1 km Buffer via OpenRouteService
Applied the OpenRouteService QGIS plugin to generate 1 km isochrone buffers around key transit hubs, capturing the area accessible within a reasonable commuting distance.
Accessibility Visualisation
Styled and overlaid the buffer areas on the base map to produce a clear cartographic output highlighting well-served zones versus underserved areas of Berlin.
Tools & Technologies
- QGIS with OpenRouteService plugin for isochrone generation
- Berlin open GTFS data for transit stop locations
- 1 km buffer / isochrone analysis
Applications
- City planning and infrastructure investment decisions
- Transportation network optimisation
- Improving accessibility for residents in underserved areas
Outcome
Produced a clear navigation-themed accessibility map for Berlin showing commute-distance coverage around key transit hubs — demonstrating practical use of GTFS data and OpenRouteService buffers for urban mobility analysis.