Overview
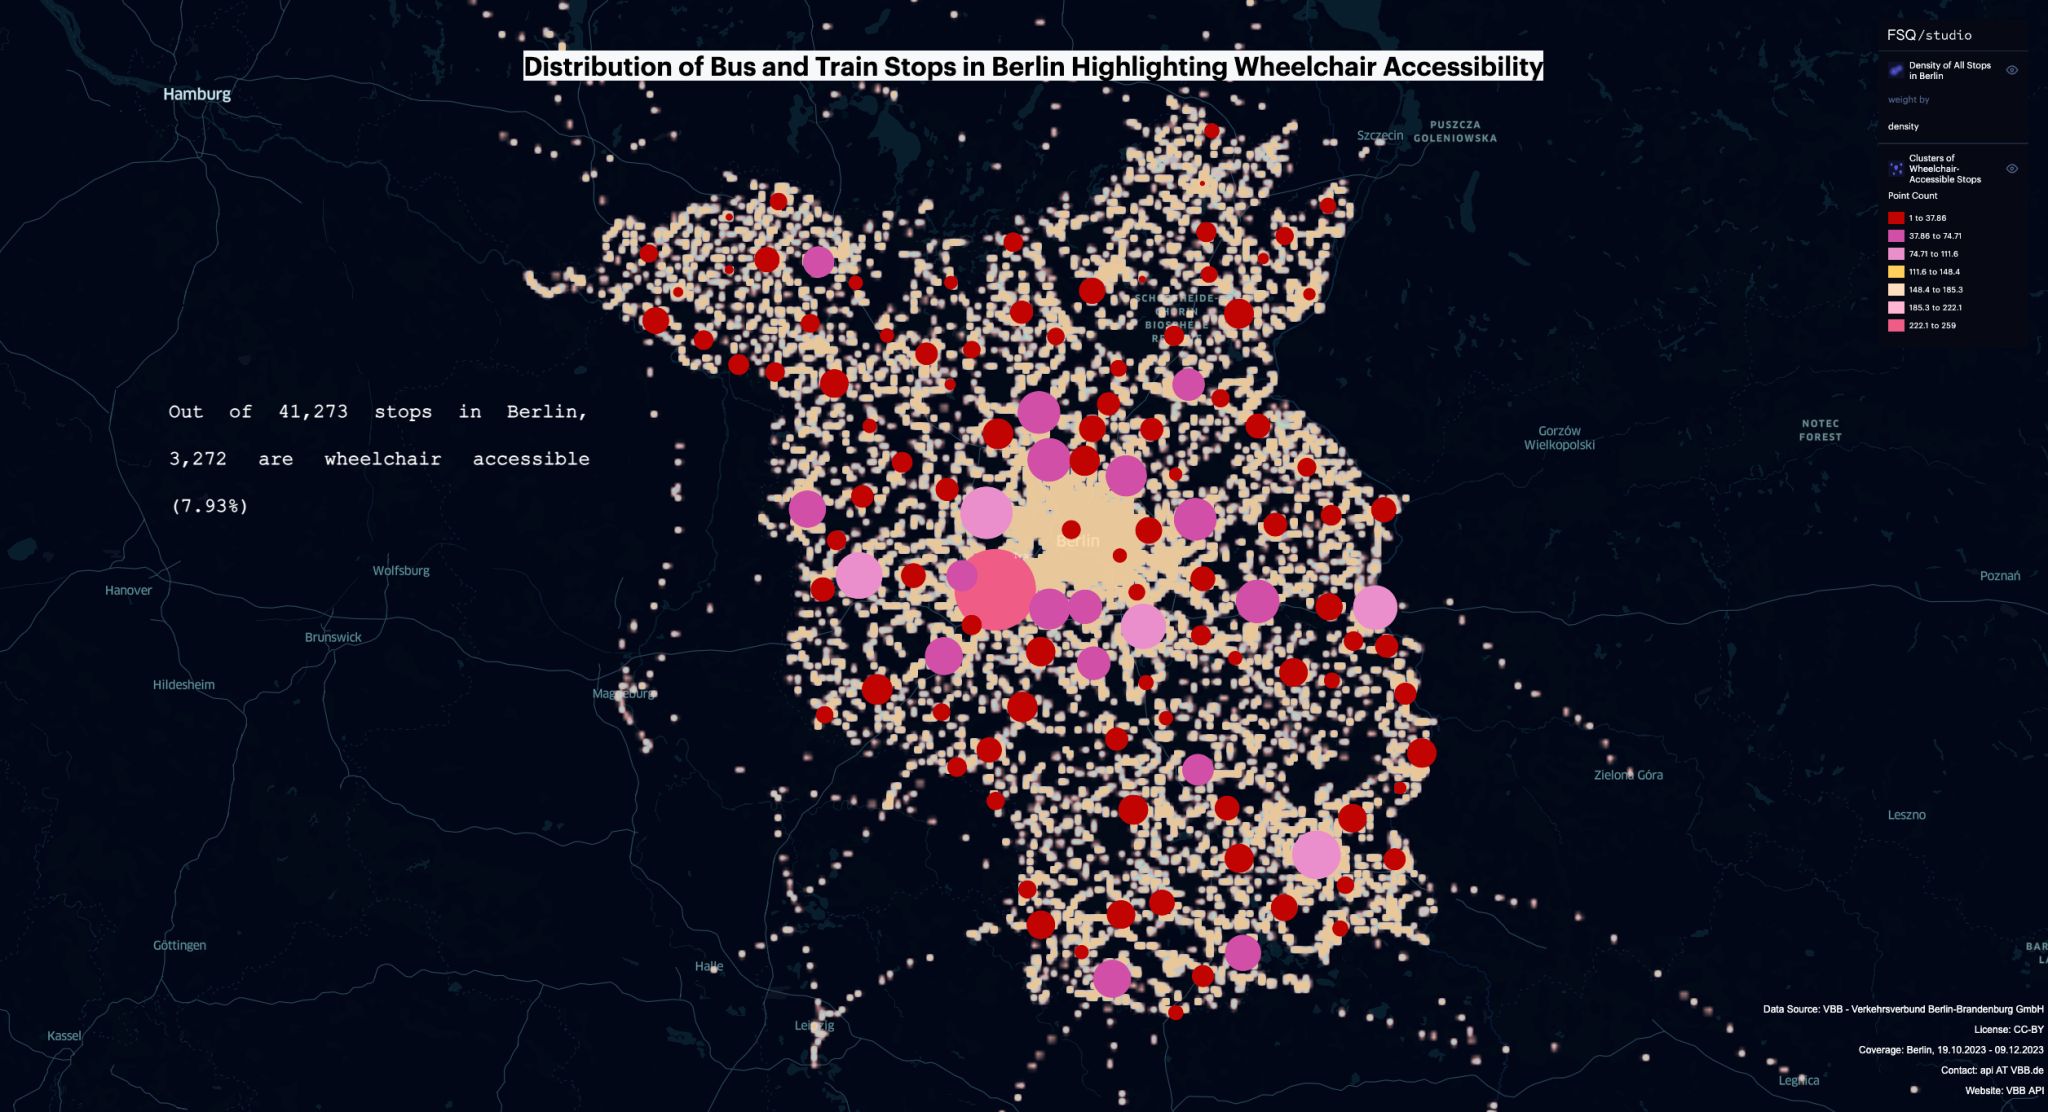
This project explores Berlin public transport stop accessibility using GTFS data sourced from Daten Berlin. The work focuses on visualising the distribution of all transit stops and highlighting where wheelchair-accessible stops are more concentrated or more limited.
Methodology
GTFS Stop Data
Used Berlin GTFS stop attributes to separate all transit stops from stops marked as wheelchair accessible.
Heatmap Visualisation
Created QGIS heatmaps to show the wider distribution and density of Berlin's public transport stops.
Wheelchair Stop Clusters
Built varying-size point clusters in QGIS where larger clusters indicate more wheelchair-friendly stops and smaller clusters point to areas with fewer accessible stops.
Foursquare Studio Mapping
Enhanced the final accessibility visualisation in Foursquare Studio to communicate mobility gaps clearly for public transport planning.
Tools & Technologies
- GTFS public transport stop data from Daten Berlin
- QGIS for heatmaps and wheelchair-accessible stop clusters
- Foursquare Studio for final visualisation
- Accessibility-focused data visualisation for urban mobility planning
Outcome
The maps highlight where wheelchair-accessible transit stops are concentrated and where smaller clusters suggest potential priorities for infrastructure improvements. The output supports planning discussions around more inclusive public transport systems where mobility is treated as a right for all.