Overview
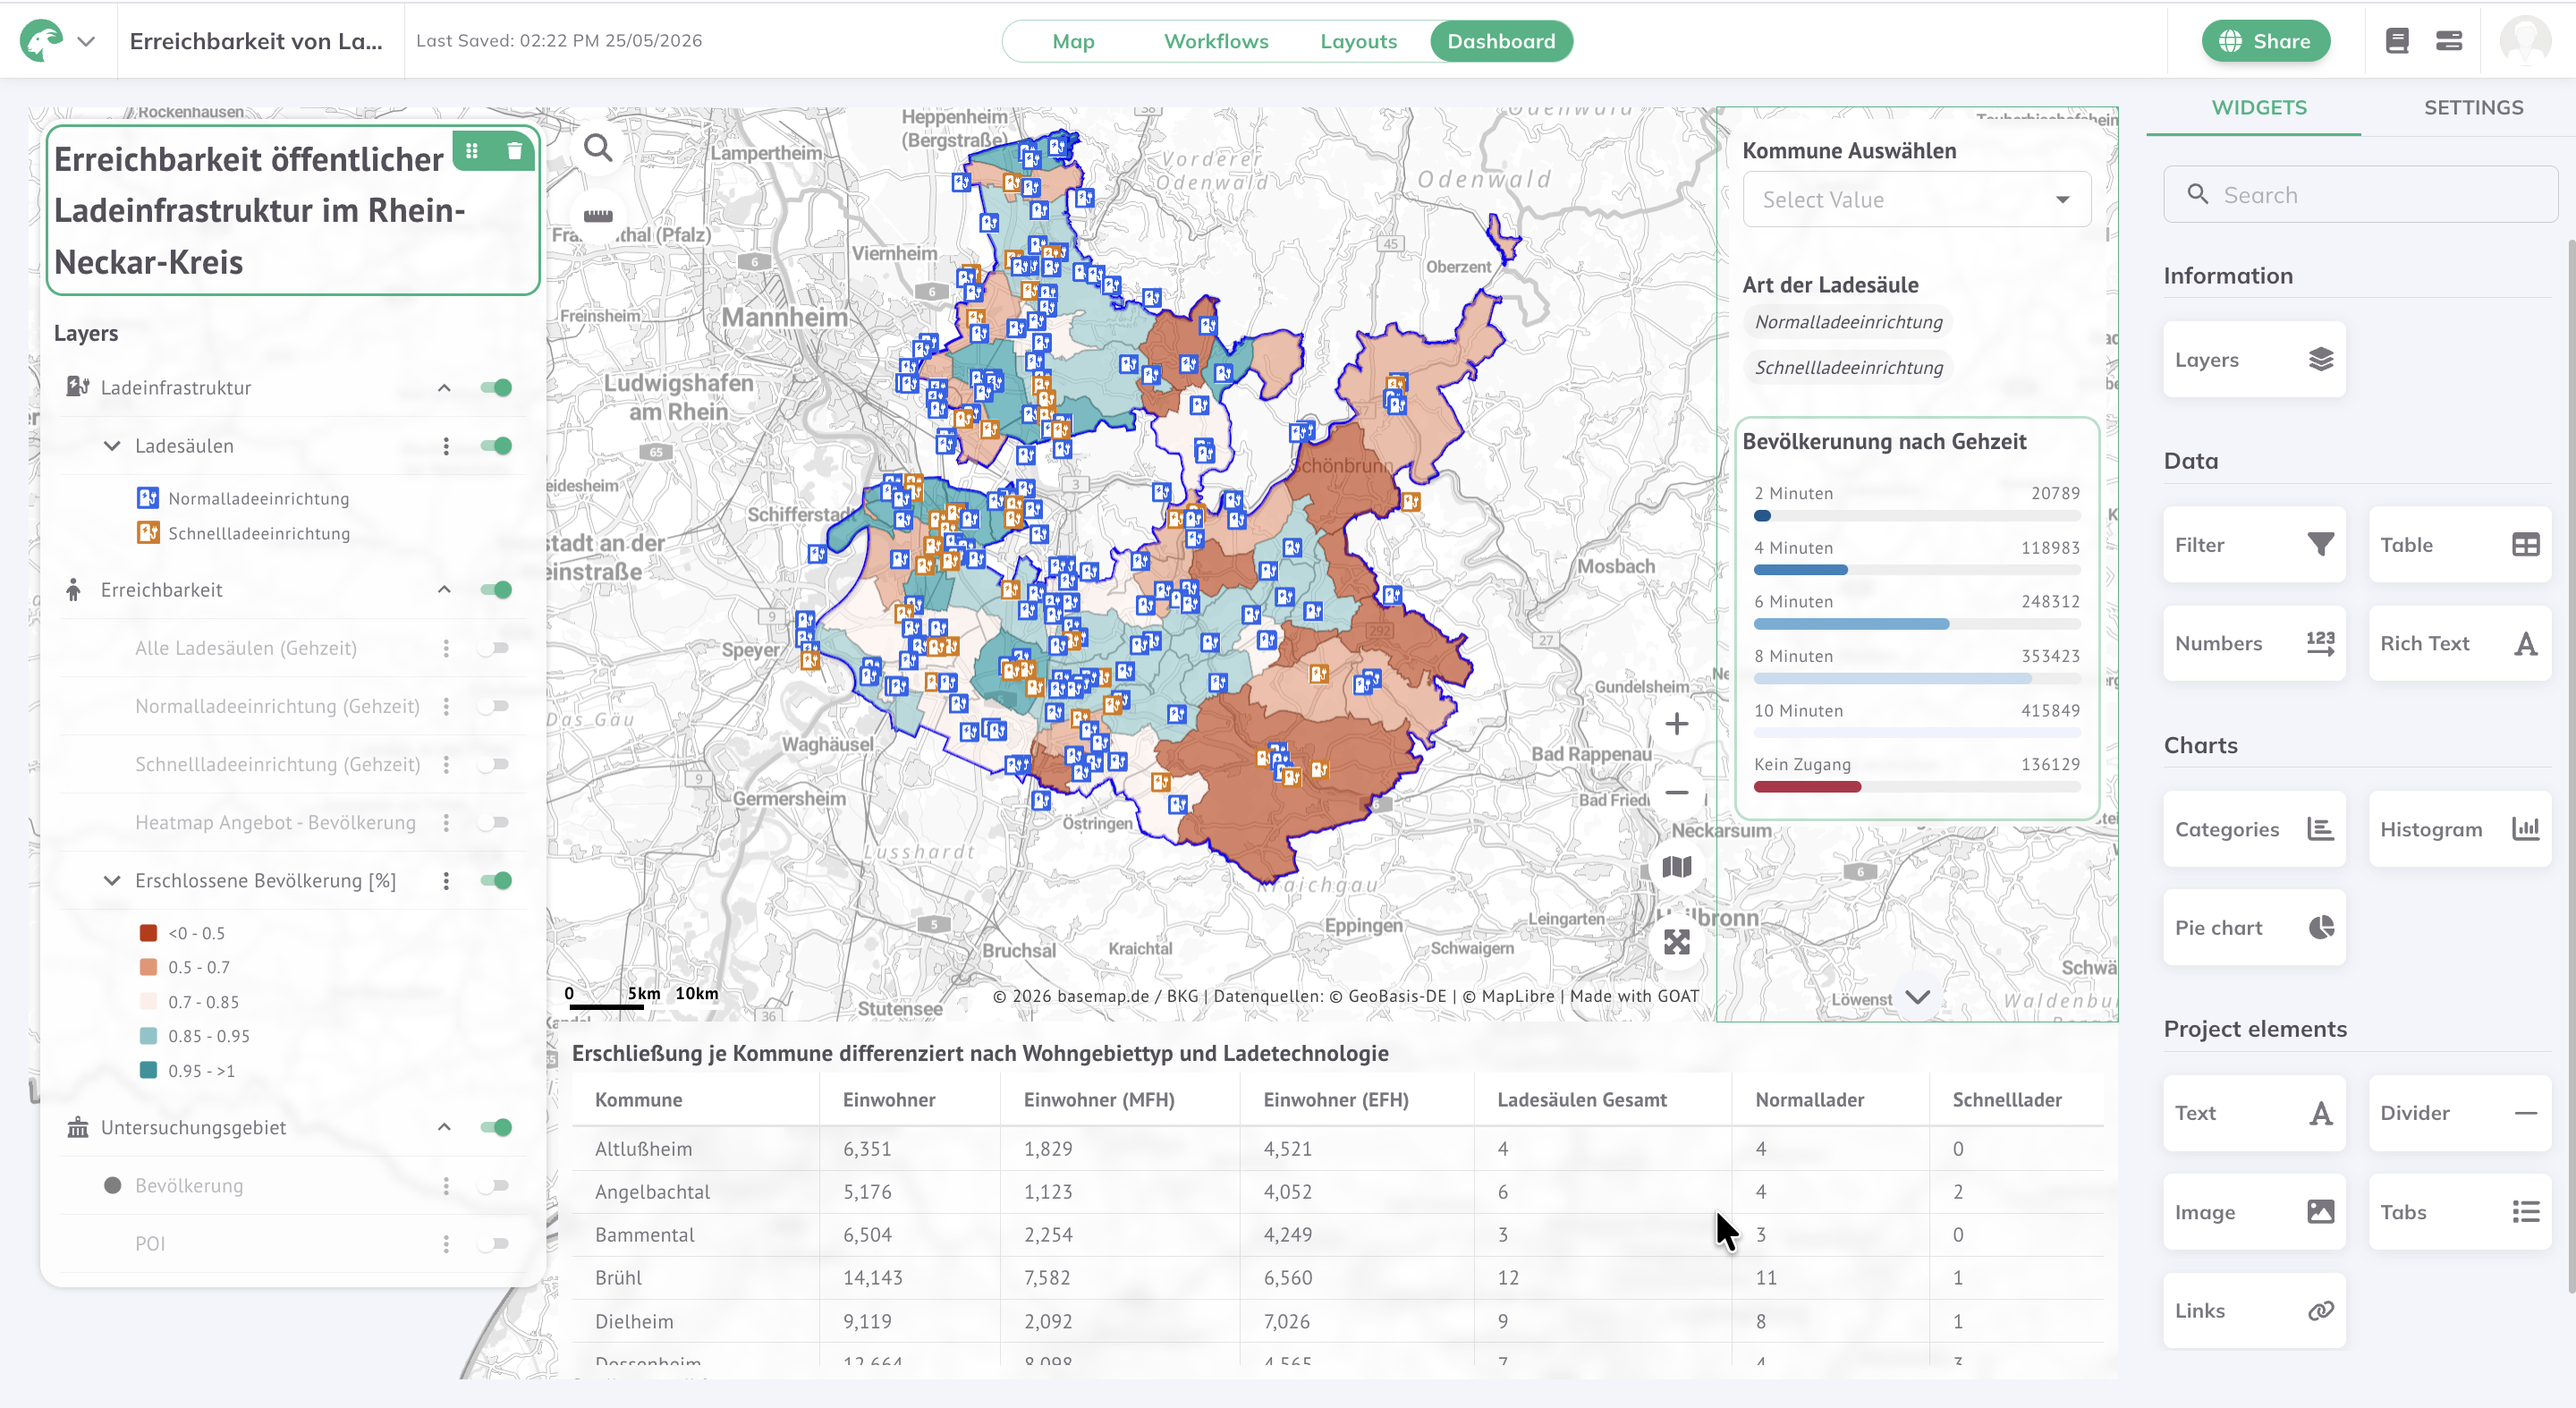
An interactive GOAT dashboard analysing the accessibility of public EV charging infrastructure across the entire Rhein-Neckar-Kreis region. The analysis evaluates walking-time catchments from both standard (Normalladeeinrichtung) and fast (Schnellladeeinrichtung) charging stations, and breaks down the population reached by housing type — multi-family homes (MFH) and single-family homes (EFH) — for each municipality.
The dashboard enables planners to identify municipalities with low charging coverage and understand which residential areas are most underserved by the current charging network.
Methodology
Charging Station Data
Loaded all public charging station locations in the Rhein-Neckar-Kreis, classified by type: Normalladeeinrichtung (standard AC charging) and Schnellladeeinrichtung (fast DC charging).
Walking-Time Accessibility
Generated walking-time catchments at 2, 4, 6, 8 and 10 minute intervals from each charging station using the GOAT platform's network-based accessibility engine, identifying the population reachable at each threshold.
Population Segmentation by Housing Type
Overlaid population data differentiated by MFH (Mehrfamilienhaus / multi-family) and EFH (Einfamilienhaus / single-family) housing type, to understand whether charging access differs across residential contexts.
Municipality-Level Dashboard
Built an interactive GOAT dashboard with a Kommune Auswählen filter and per-municipality table showing total charging stations, standard chargers, fast chargers, total residents and residents by housing type — enabling targeted comparison across all municipalities in the district.
Dashboard Features
- Filter by municipality (Kommune Auswählen) to focus the map and statistics
- Filter by charger type — standard vs fast charging
- Bevölkerung nach Gehzeit — population reached at each walking-time threshold
- Erschlossene Bevölkerung [%] — percentage of population covered, shown as a choropleth per municipality
- Per-municipality table: Erschließung je Kommune differenziert nach Wohngebiettyp und Ladetechnologie
- Heatmap layer showing supply–demand balance (charging stations vs population)
Tools & Technologies
- GOAT (Plan4Better) — accessibility engine, dashboard and visualisation
- Walking-time catchments (2–10 minutes) for network-based coverage analysis
- Population data segmented by housing type (MFH / EFH)
- Public EV charging station data for Rhein-Neckar-Kreis
Outcome
Delivered a fully interactive accessibility dashboard for the Rhein-Neckar-Kreis that gives planners and policymakers a clear, municipality-level picture of where public EV charging is well-served and where investment is most needed — differentiated by charger type and housing context.