Overview
This project marks a milestone in a personal journey from zero programming background to Python proficiency in spatial analysis. Completed as part of Ujaval Gandhi's (Spatial Thoughts) course, the project visualises railway station data along lines using the Deutsche Bahn WEB API, Python, GeoPandas and Pandas.
Discovering the intersection of Python, QGIS and spatial analysis was transformative — merging a passion for geospatial work with the ability to turn ideas into code and automate analysis at scale.
Methodology
Deutsche Bahn WEB API
Fetched live railway station data along lines from the Deutsche Bahn WEB API, providing an up-to-date dataset of NRW's station network.
Data Processing with Python
Used Pandas to clean and structure the API response data, and GeoPandas to handle spatial operations and geometries.
Visualisation
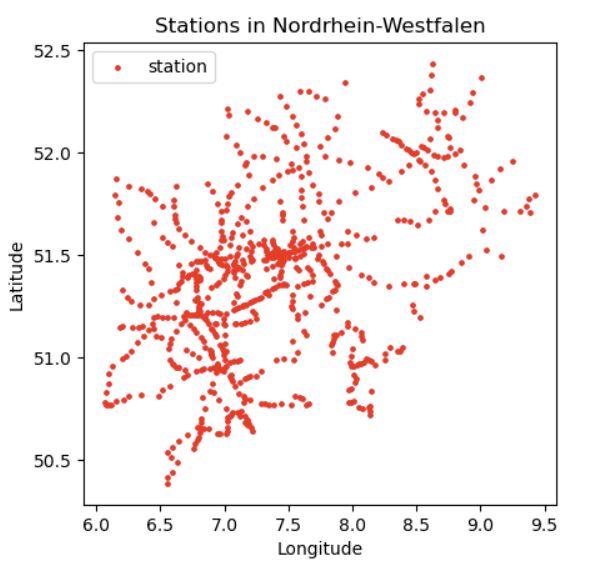
Produced a spatial visualisation of the railway station data along lines, demonstrating the full pipeline from API call to cartographic output using Python.
Tools & Technologies
- Python — GeoPandas, Pandas
- Deutsche Bahn WEB API — live railway station data
- Spatial Thoughts course — guided by Ujaval Gandhi
Acknowledgements
- Ujaval Gandhi (Spatial Thoughts) — course instructor and mentor whose interactive lectures made spatial Python accessible
- Vigna Purohit — teaching assistant whose guidance was instrumental throughout the learning journey
Outcome
Successfully visualised NRW railway station data along lines via the Deutsche Bahn API using Python — completing a challenging project that marked the transition from no programming background to confident spatial Python scripting.