Overview
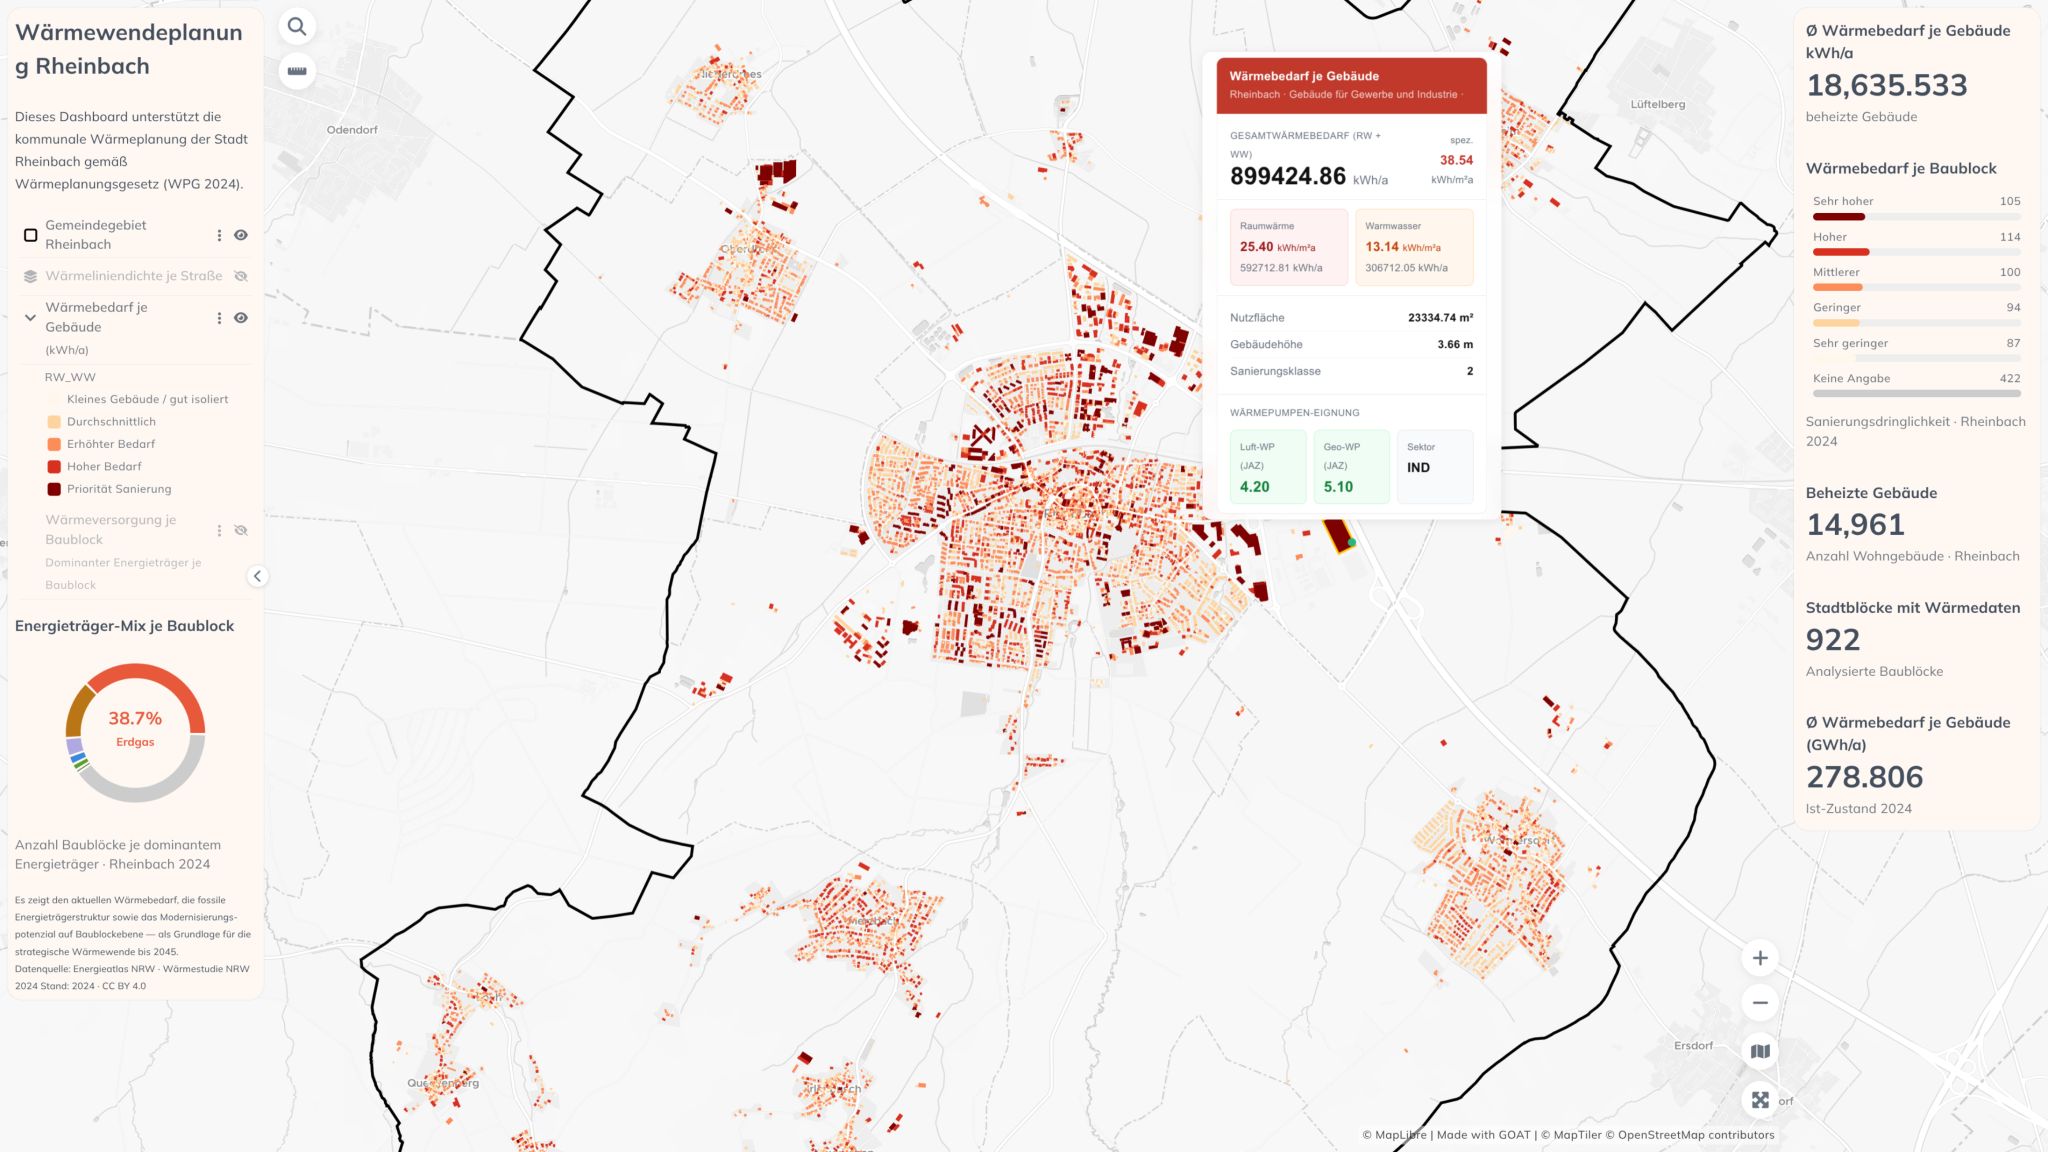
An interactive GOAT dashboard for kommunale Wärmeplanung in Rheinbach, NRW, built on open data from the LANUV Wärmestudie NRW. The goal was to make building-level heat demand data genuinely useful for municipal planners — not just display it on a map, but surface the indicators that matter in a clean, clickable interface.
Users can click on any building and immediately see key heat-planning indicators in a custom HTML popup, making the data easier to explain to non-GIS stakeholders than a standard attribute table. The workflow is based entirely on open data and can be replicated for any NRW municipality by changing the AGS code.
Key Numbers
- 14,961 heated residential buildings analysed
- 922 city blocks with heat demand data
- 38.7 % of city blocks primarily run on gas
- 18,635 kWh/a average heat demand per building
Methodology
Data Source — LANUV Wärmestudie NRW
Loaded building-level heat demand data from the LANUV Wärmestudie NRW open dataset. The data covers heated residential buildings across NRW and includes spatial geometry, energy demand, and building characteristics — all accessible by AGS code, making the workflow portable across municipalities.
Building-Level Indicators
For each building the dashboard surfaces: Gesamtwärmebedarf, Raumwärme and Warmwasser split, Nutzfläche, Gebäudehöhe, Sanierungsklasse, Wärmepumpen-Eignung, and JAZ values for both Luft-Wärmepumpe and Geo-Wärmepumpe — giving planners the full picture at a single click.
Custom HTML Popup Design
Customised the GOAT feature info popup using HTML so the layout is structured and readable — closer to a planning brief than a raw GIS attribute dump. This makes it significantly easier to use in conversations with municipal clients who are not GIS users.
City Block Aggregation
Aggregated building data to 922 city blocks to enable neighbourhood-level heat demand mapping and identify which blocks are most dependent on gas heating, supporting prioritisation for retrofit and heat network planning.
Dashboard Features
- Click any building to see full Wärmeplanung indicators in a clean custom popup
- Gesamtwärmebedarf, Raumwärme and Warmwasser split per building
- Nutzfläche, Gebäudehöhe, and Sanierungsklasse at a glance
- Wärmepumpen-Eignung with JAZ values for Luft-WP and Geo-WP
- City block layer showing gas dependency distribution across Rheinbach
- Replicable for any NRW municipality by changing the AGS code
Tools & Technologies
- GOAT (Plan4Better) — dashboard, map visualisation and custom popup design
- LANUV Wärmestudie NRW — open data source for building-level heat demand
- HTML — custom popup layout for non-GIS stakeholder communication
- AGS-based workflow for portability across NRW municipalities
Outcome
Delivered a fully interactive kommunale Wärmeplanung dashboard for Rheinbach that translates LANUV open data into a planning tool — with building-level detail, readable popups, and city block aggregations that give municipal planners a clear picture of heat demand, gas dependency, and heat pump suitability across the city.