Overview
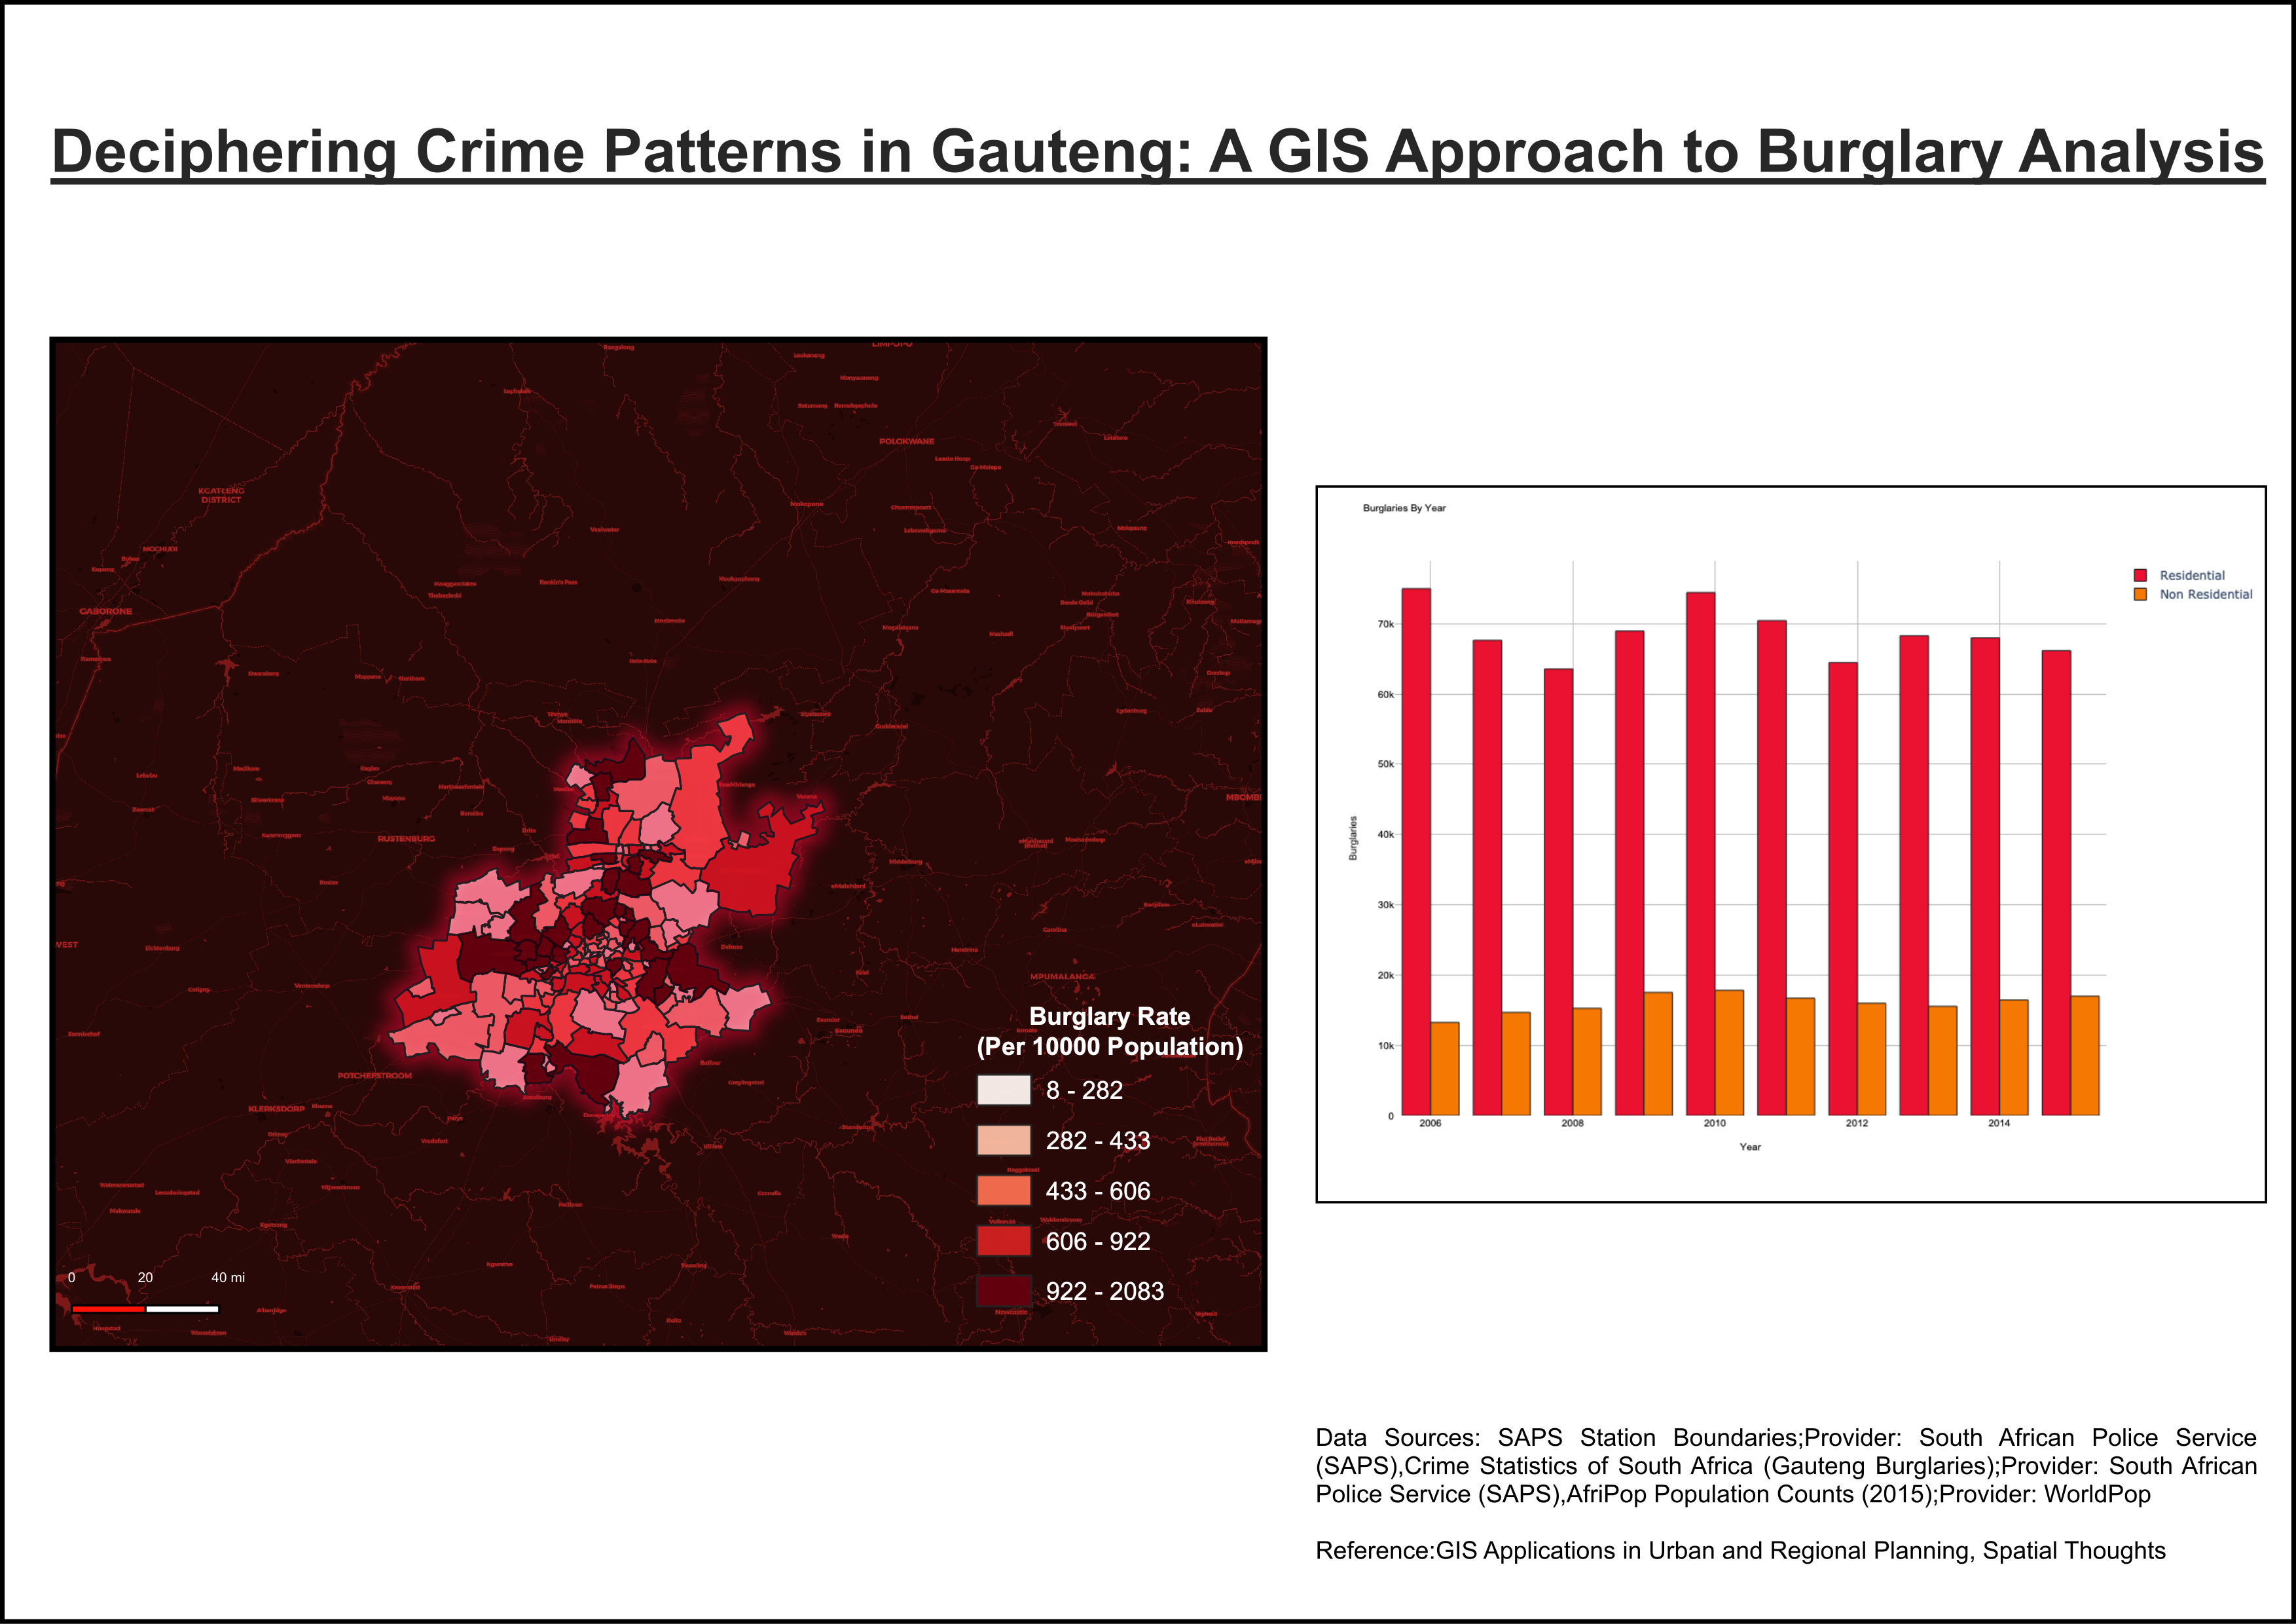
Spatial analysis of burglary rates in Gauteng, South Africa, normalised per 10,000 population. The project combines crime statistics, police station boundaries and population data to visualise where burglary rates are more concentrated across the province.
Methodology
Crime and Boundary Join
Joined SAPS crime statistics to station boundaries and point data in QGIS to connect burglary counts with their spatial reporting areas.
Population Normalisation
Used AfriPop 2015 population counts with raster analysis and zonal statistics to calculate burglary rate per 10,000 population.
Mapping and Time Series
Created the final choropleth map in QGIS and used the Plotly plugin to support time-series visualisation of burglary patterns.
Interpretation
Used vector analysis to identify areas where burglary rates may be relevant for urban safety planning, community awareness and policy discussion.
Tools & Technologies
- QGIS 3.28.8 Firenze
- Table joins, raster analysis and zonal statistics
- Plotly plugin for time-series visualisation
- Vector analysis for spatial interpretation
Data Credits
- SAPS station boundaries and points
- Crime Statistics of the Republic of South Africa
- AfriPop Population Counts 2015
- Methodological guidance and inspiration from Spatial Thoughts articles
Outcome
Produced a burglary-rate map for Gauteng that supports discussion around public safety, smart city planning, community-driven safety initiatives and future forecasting of potential burglary hotspots.