Overview
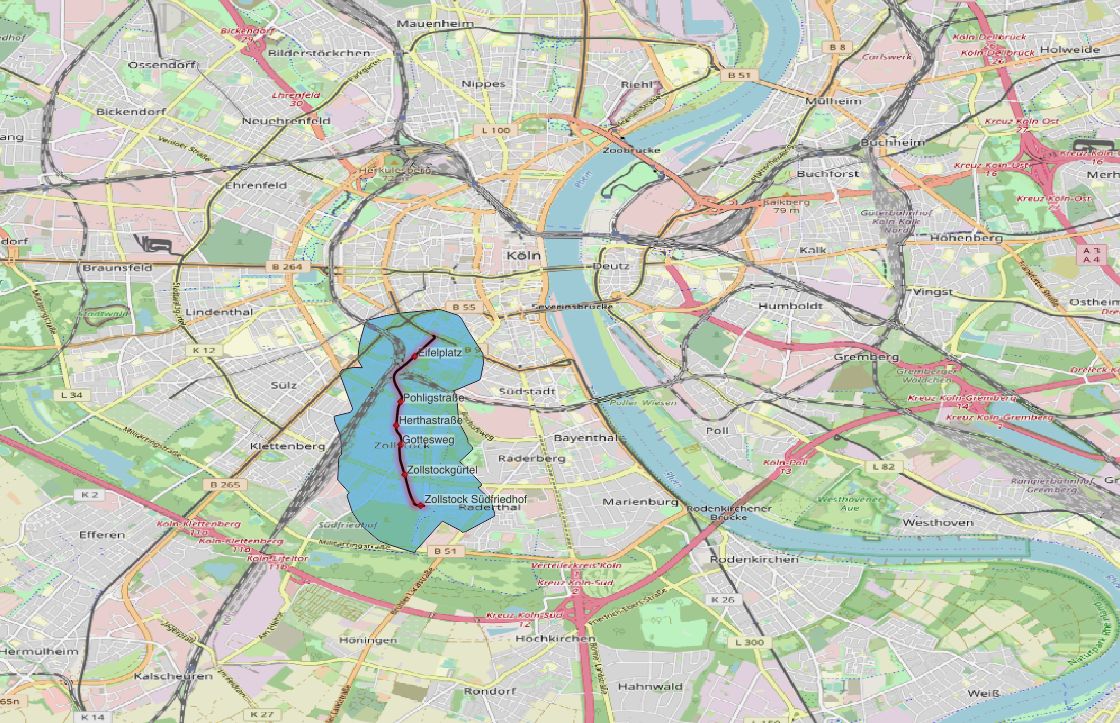
As part of exploring QGIS for railway and transit projects — including analysing rail networks, optimising routes and mapping railway infrastructure — this project uses the OpenRouteService plugin in QGIS to generate isochrones showing the 10-minute walking distance catchment of Cologne's tram network.
Isochrones offer valuable insights into travel times and accessibility, showing exactly which areas can be reached from tram stops within a given time — far more informative than simple circular buffers.
Methodology
Railway Network Data
Loaded Cologne's tram network data from Geofabrik, preparing stop locations as origin points for the service area analysis.
Isochrone Generation
Used the OpenRouteService plugin in QGIS to generate 10-minute walking isochrones from tram stops, based on the real pedestrian road network rather than straight-line distances.
Accessibility Visualisation
Mapped the resulting isochrones across Cologne to reveal which areas are within a 10-minute walk of the tram network and highlight connectivity gaps.
Tools & Technologies
- QGIS with OpenRouteService plugin — isochrone / service area generation
- Geofabrik — detailed railway and tram network data
- Methodology based on Spatial Thoughts Service Area Analysis documentation
Outcome
Produced a visualisation of the areas within 10 minutes' walk of Cologne's tram network, demonstrating how isochrones can reveal real accessibility patterns and support decisions around urban mobility and transit planning.