Overview
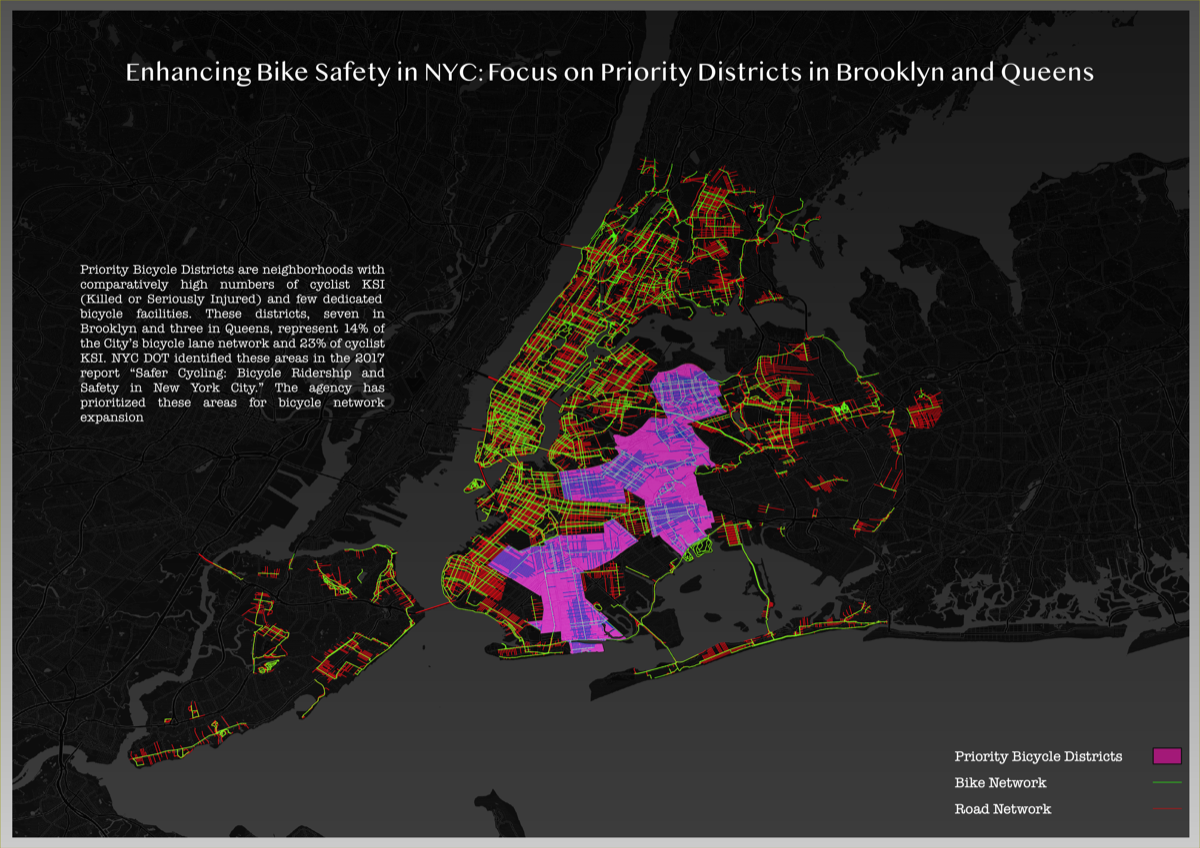
Day 10 of the #30DayMapChallenge — theme: North America. This map highlights NYC neighbourhoods with high cyclist KSI (Killed or Seriously Injured) incidents and limited bike lanes, underscoring the urgent need for enhanced cycling infrastructure across the city.
This entry also marked the conclusion of the 2023 #30DayMapChallenge — 10 days of productive and enlightening map-making.
Methodology
Priority Area Data
Loaded the VZV_Bike Priority Areas dataset from the NYC Open Data Portal, identifying neighbourhoods with disproportionately high cyclist KSI rates and insufficient dedicated bike infrastructure.
Road Network
Integrated the road network from Geofabrik to provide spatial context for the priority areas and existing bike lane coverage.
Cartographic Output
Styled and composed the final map in QGIS, communicating where bicycle infrastructure expansion would have the strongest safety impact.
Data Sources
- VZV_Bike Priority Areas — NYC Open Data Portal
- Road Network — Geofabrik
Tools & Technologies
- QGIS for processing, styling and map layout
Outcome
Produced a clear map of NYC's cyclist KSI hotspots, communicating where dedicated cycling infrastructure is most needed and bringing awareness to bike safety priorities across the city's boroughs.