Overview
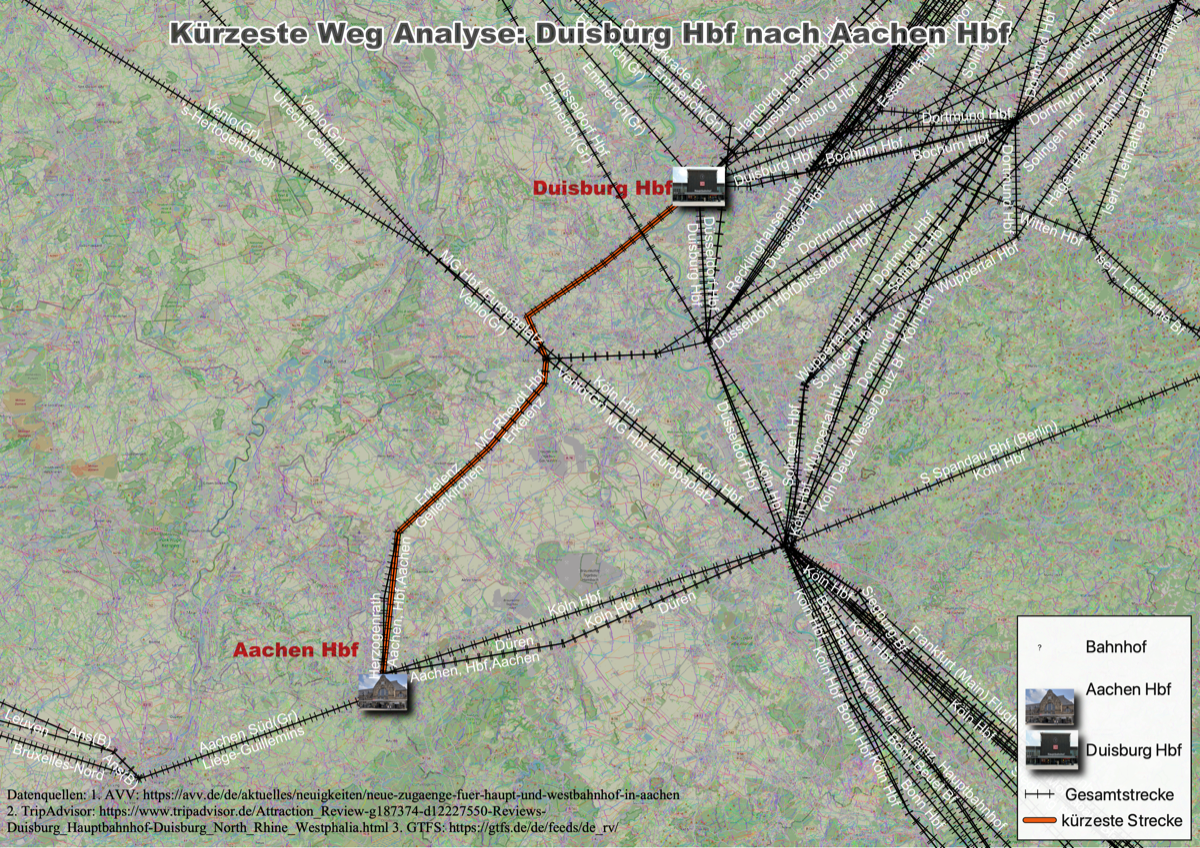
An exploration into the world of GTFS as a newcomer to the format — experimenting with QGIS and the GTFS-GO plugin to load, render, and visualise transit routes and stops innovatively on a map. The centrepiece is a shortest-path analysis between Duisburg Hbf and Aachen Hbf using the NRW/AVV open GTFS feed.
Note: the visualisation represents the geometric shortest path only. It does not account for buffer time, dwell time, passenger waiting, or scheduled timetable — all labels are in German, reflecting the source data.
Methodology
GTFS-GO Plugin
Used the QGIS GTFS-GO plugin to import the AVV/NRW GTFS feed directly, rendering transit routes and stop points as styled vector layers in QGIS.
Shortest Path Analysis
Applied QGIS's built-in network analysis via processing.run("native:shortestpathpointtopoint", {...}) to compute and visualise the shortest path from Duisburg Hbf to Aachen Hbf across the stop network.
Cartographic Output
Styled the resulting path layer against the full route network to clearly highlight the corridor, with stop labels retained in German as per the source data.
Tools & Technologies
- QGIS with GTFS-GO plugin for feed import and rendering
- QGIS Network Analysis —
native:shortestpathpointtopoint - AVV / NRW open GTFS data
Data Sources
- AVV (Aachener Verkehrsverbund) GTFS open data
- NRW regional GTFS feed
Outcome
Successfully rendered and visualised transit routes and stops from the NRW GTFS feed, and produced a clear shortest-path result between the two major hubs — a strong first step into GTFS-based spatial analysis in QGIS.